Azure SRE Agent portal surfaces
What each area of the agent portal holds, in the order the left navigation lists them, followed by the agent settings on the Azure side and the telemetry it writes. All of it is from a lab agent named bikramlab-sre-agent in Australia East, with one subscription and one Log Analytics connector configured.
For the setup path that produces this agent, see Set up an Azure SRE Agent. For the roles, egress modes, limits and billing rates behind these screens, see Azure SRE Agent governance reference.
Every page carries a trial banner while the waiver is active: always-on flow charges waived for the agent until a stated date and time in UTC, with active-usage charges still applying.
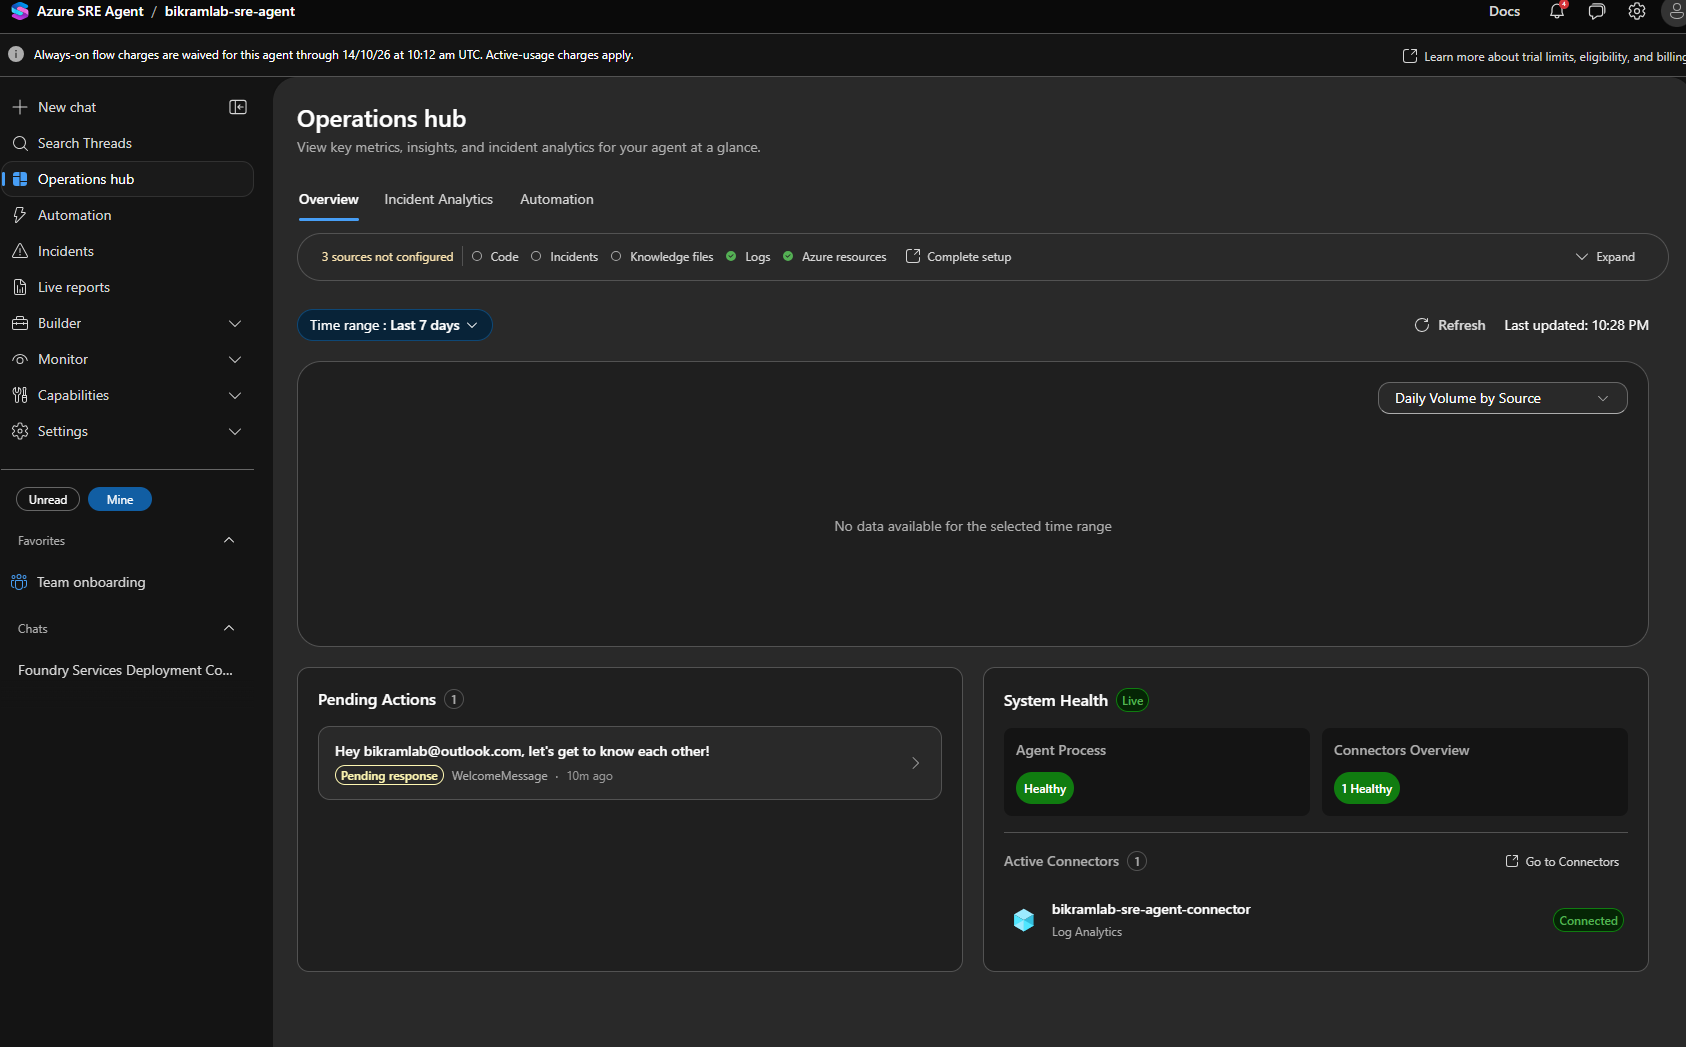
Operations hub
Three tabs: Overview, Incident Analytics, Automation. The Overview tab holds:
- A source strip across the top listing Code, Incidents, Knowledge files, Logs, and Azure resources, with a count of how many are not configured and a Complete setup link.
- A time range selector, default Last 7 days, over a chart that defaults to Daily Volume by Source.
- Pending Actions, including the agent's own welcome message, each with a status such as Pending response and an age.
- System Health, showing Agent Process status, a Connectors Overview count, and the list of Active Connectors with per connector state.
The hub can be switched off entirely from the agent settings in the Azure portal.
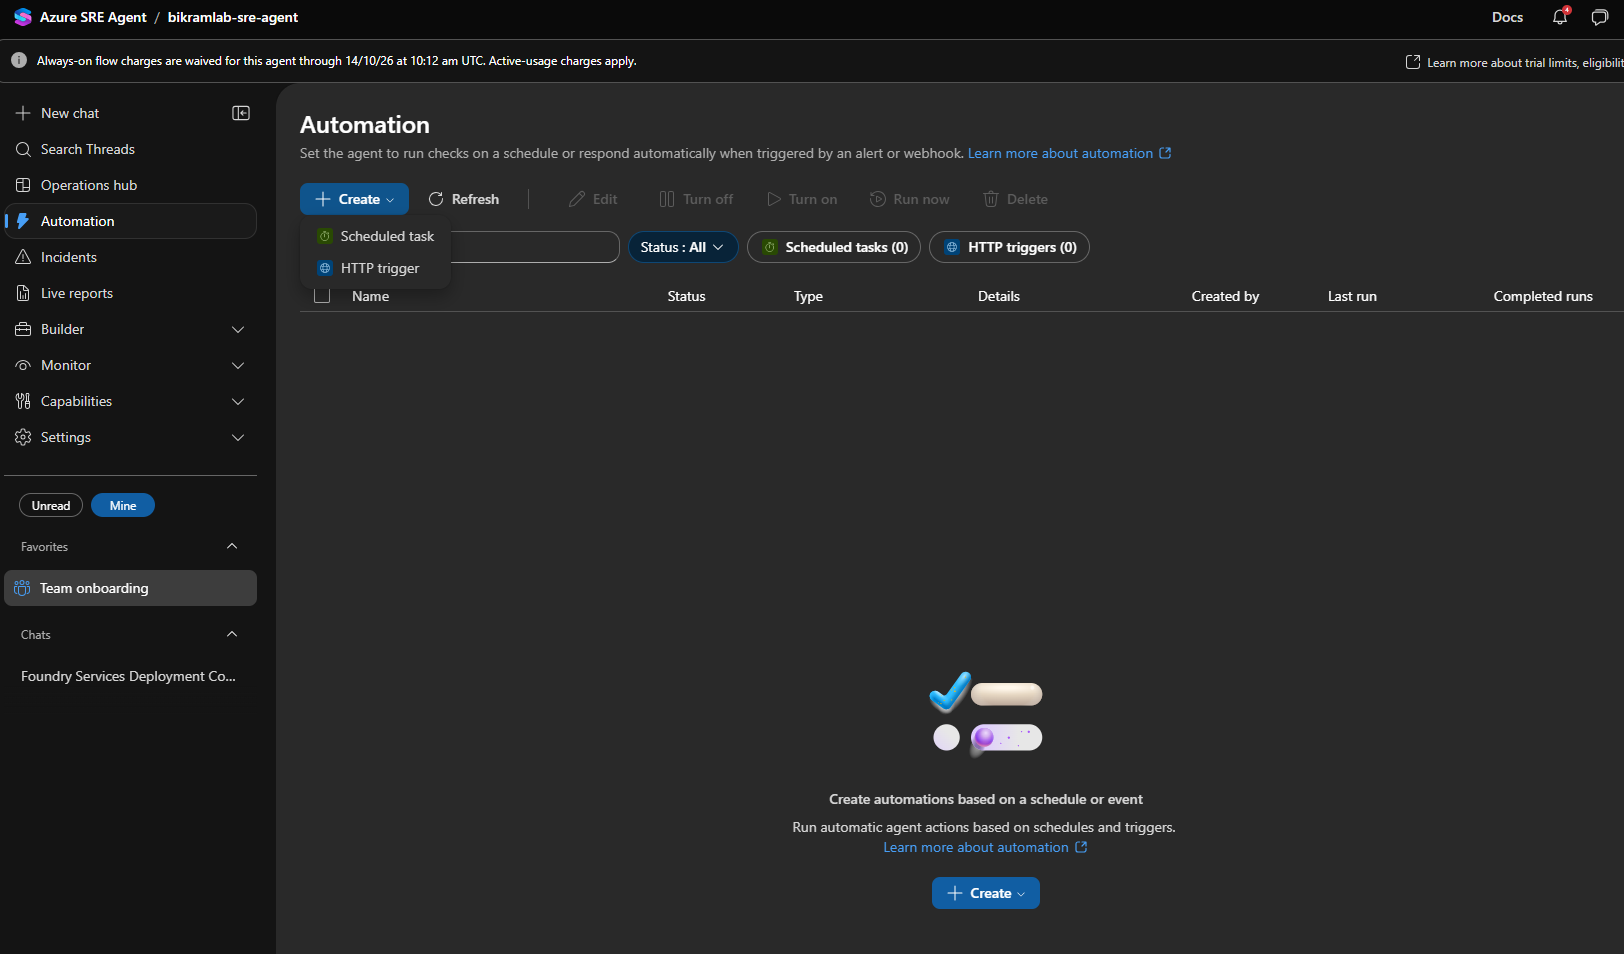
Automation
Runs agent actions on a schedule or in response to a trigger. Two types, both created from the Create menu:
- Scheduled task
- HTTP trigger, which is what an alert or webhook calls
The list view filters by status and by type, and shows name, status, type, details, created by, last run, and completed runs. Items can be edited, turned off and on, run immediately with Run now, or deleted.
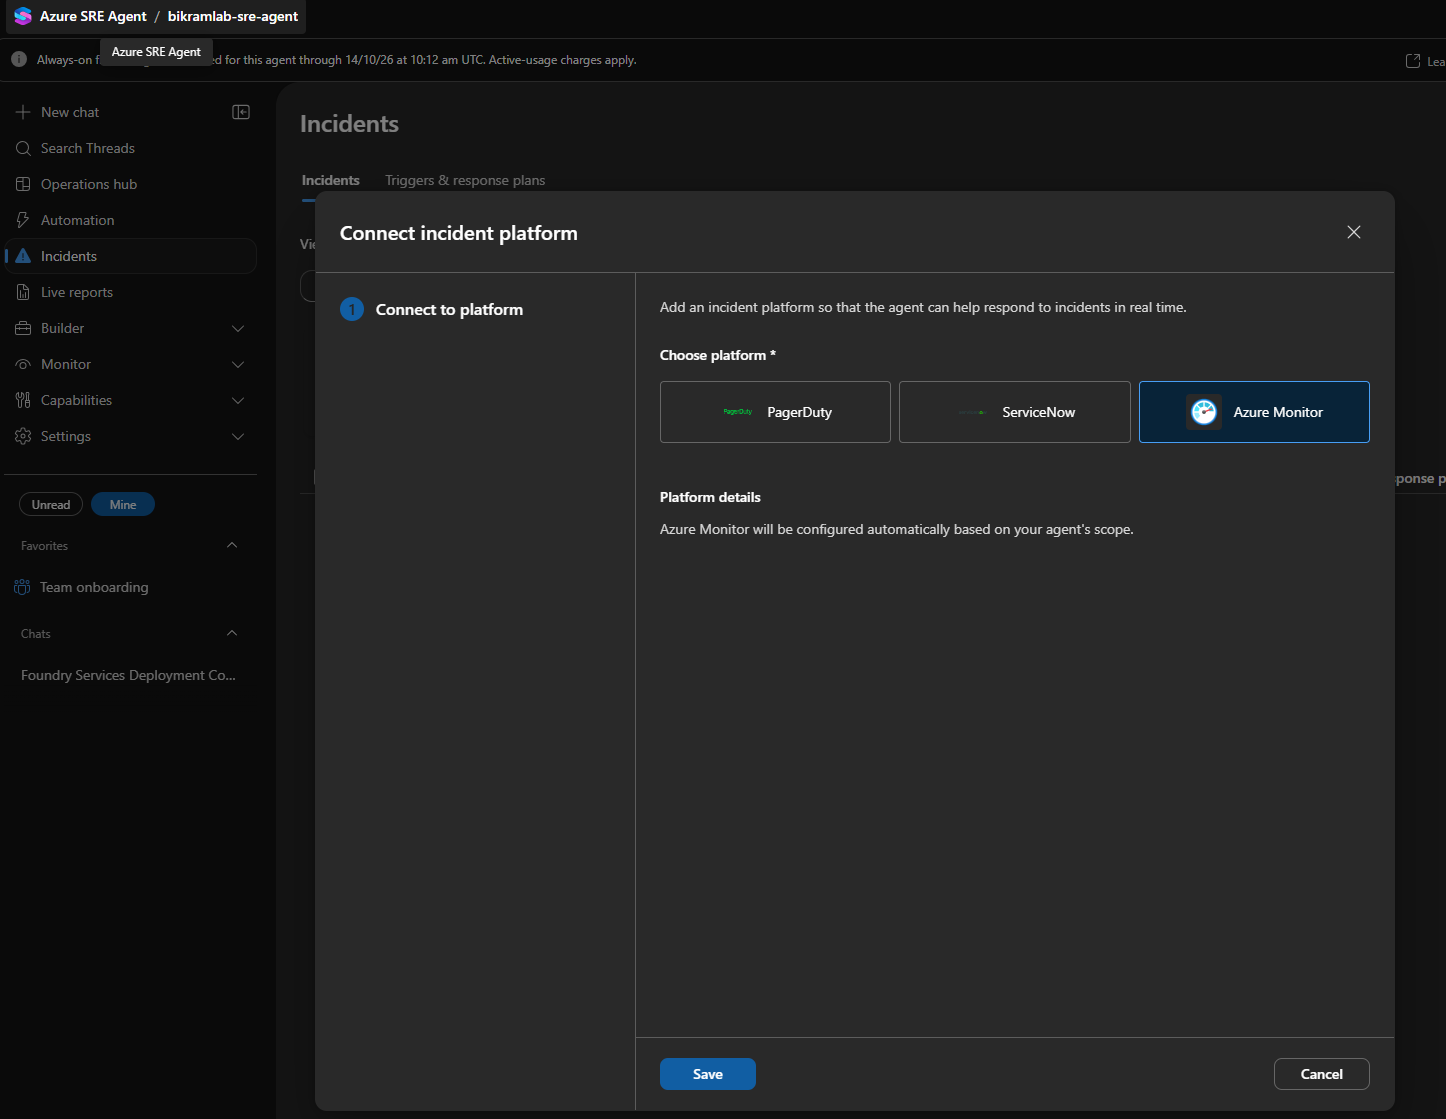
Incidents
Two tabs, Incidents and Triggers and response plans. Before anything appears, an incident platform has to be connected. Three are offered:
- PagerDuty
- ServiceNow
- Azure Monitor, which is configured automatically from the agent's existing scope rather than asking for connection details
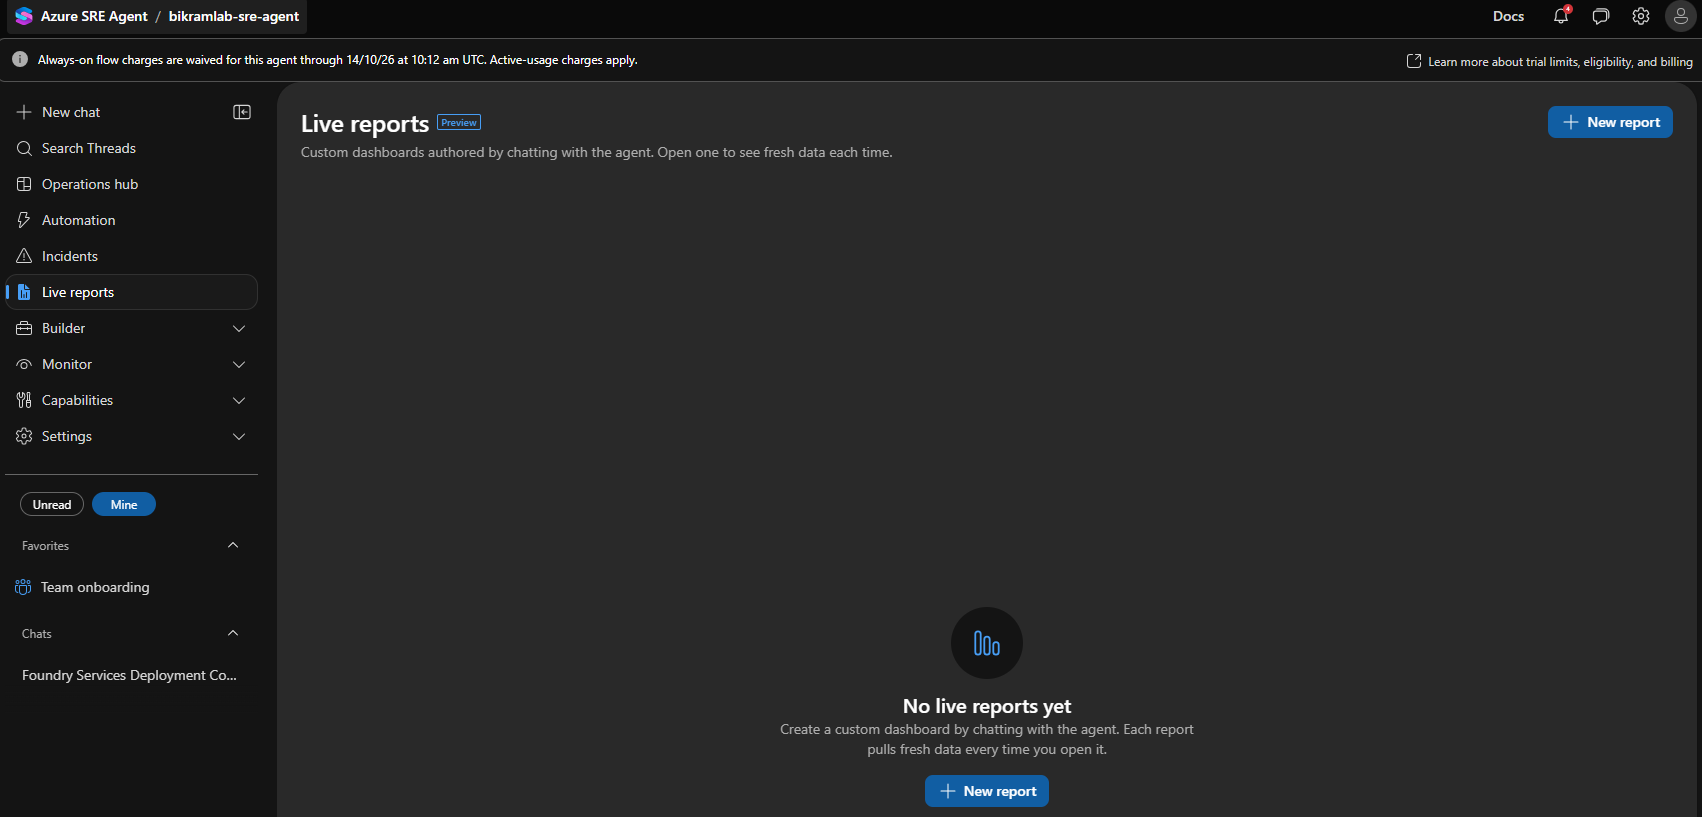
Live reports
Marked Preview. Custom dashboards authored by chatting with the agent rather than by building a query. Each report pulls fresh data every time it is opened, so what you are saving is the question, not a snapshot.
Builder
The Builder section holds Agent Canvas, Connectors, Knowledge sources, Code access, Skill builder, Plugins, and Hooks.
Connectors
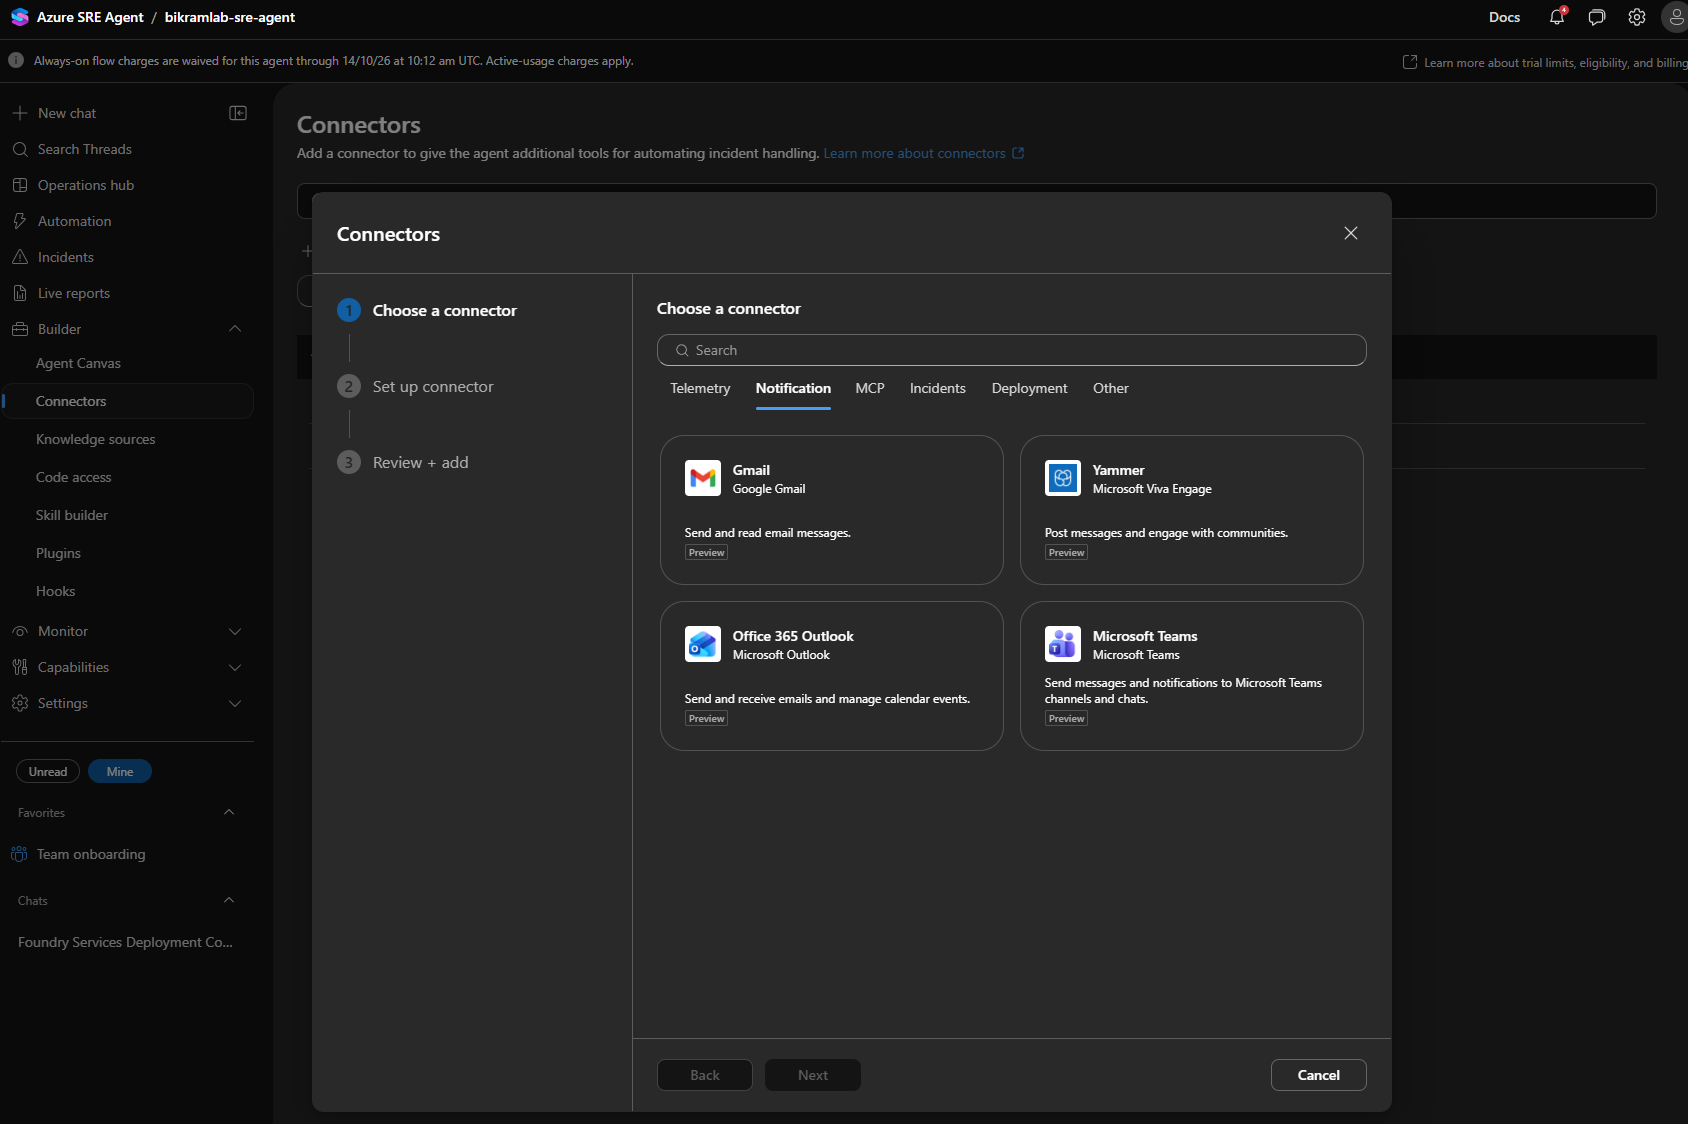
Connectors give the agent extra tools for handling incidents. The catalogue is grouped into Telemetry, Notification, MCP, Incidents, Deployment, and Other, with a search box across all of them. Adding one is a three step flow: choose a connector, set it up, review and add.
The Notification group lists Gmail, Yammer, Office 365 Outlook, and Microsoft Teams, all marked Preview.
Code access
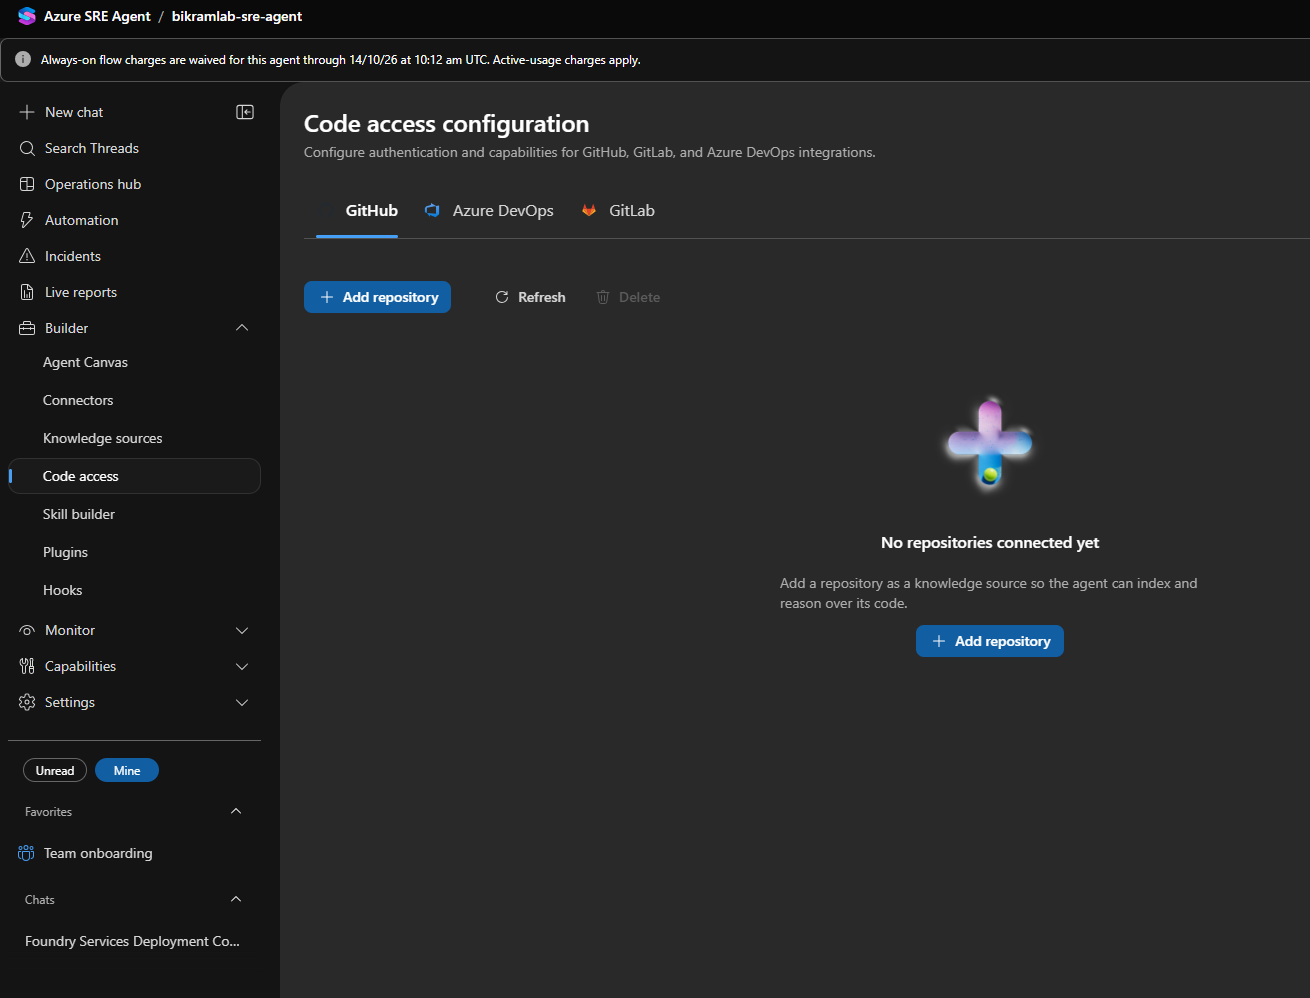
Repository access for GitHub, Azure DevOps, and GitLab, each on its own tab. A connected repository is indexed as a knowledge source so the agent can reason over the code during an investigation. Nothing is connected by default.
Plugins
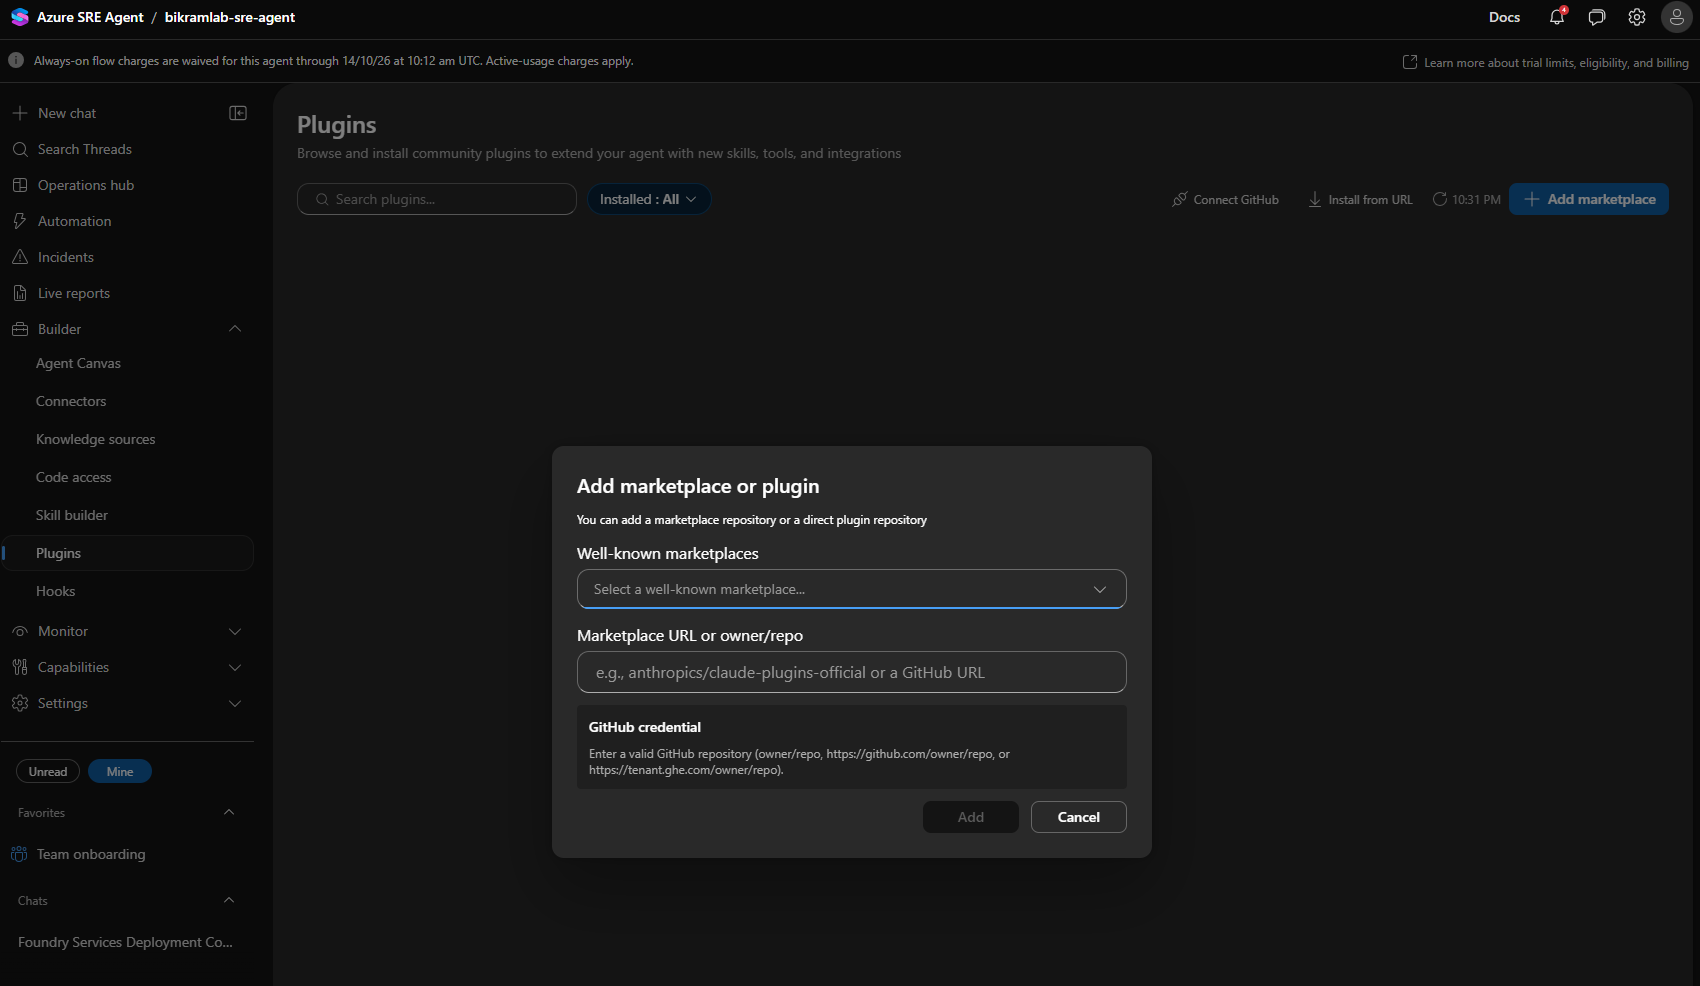
Community plugins that add skills, tools, and integrations. Plugins come from a marketplace repository or a direct plugin repository, and the add dialog takes either a well known marketplace from a dropdown or a owner/repo value or GitHub URL, including a GitHub Enterprise host. The toolbar also offers Connect GitHub and Install from URL, and the list filters by installed state.
Settings
Five pages: Basics, Managed resources, Azure settings, Workspace configuration, and Agent consumption.
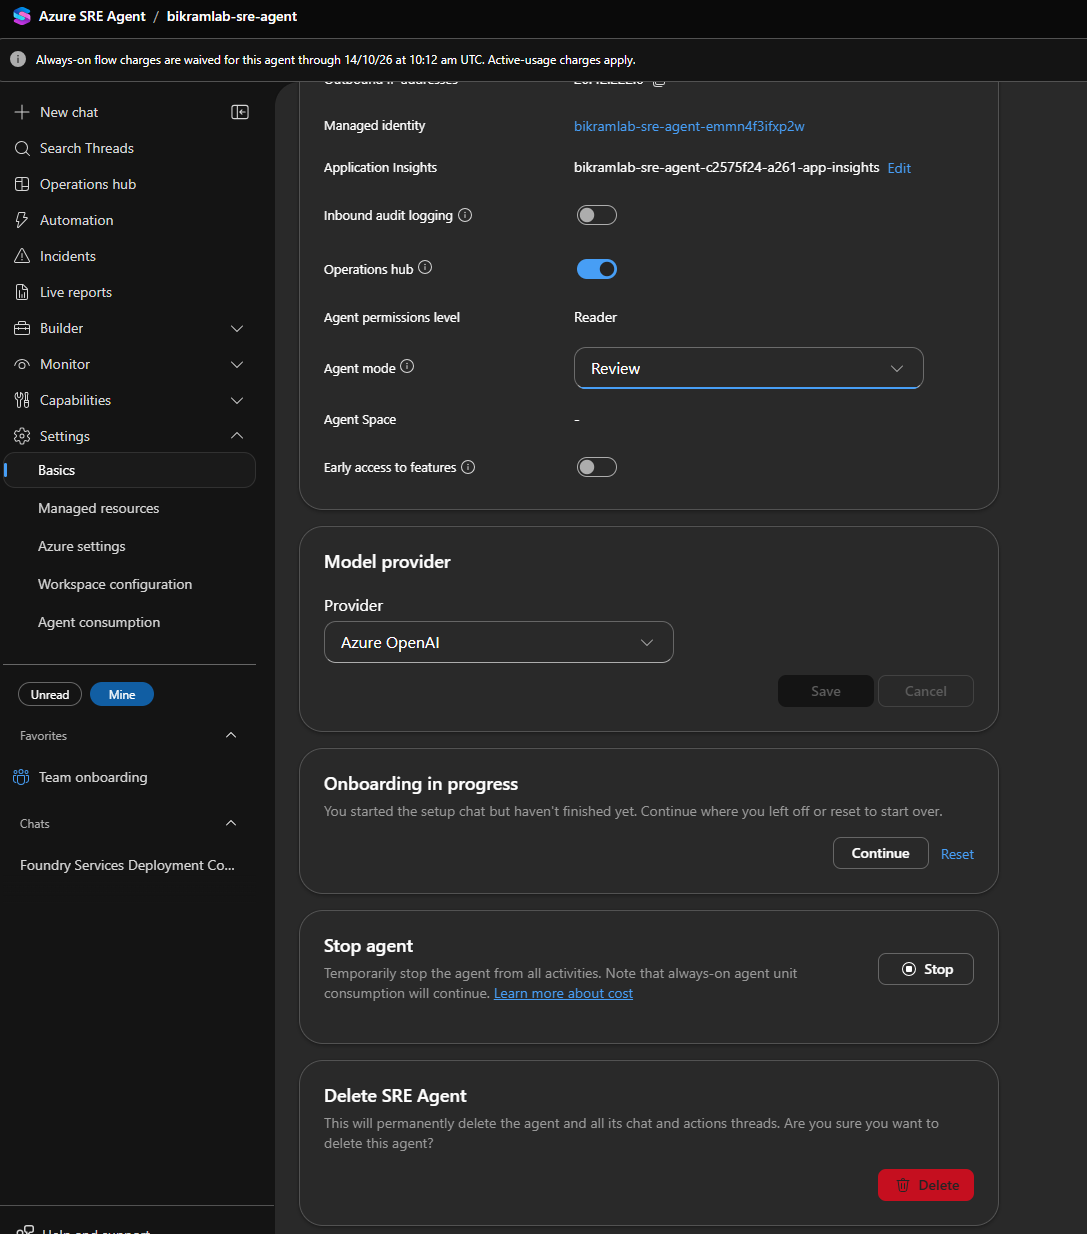
Basics
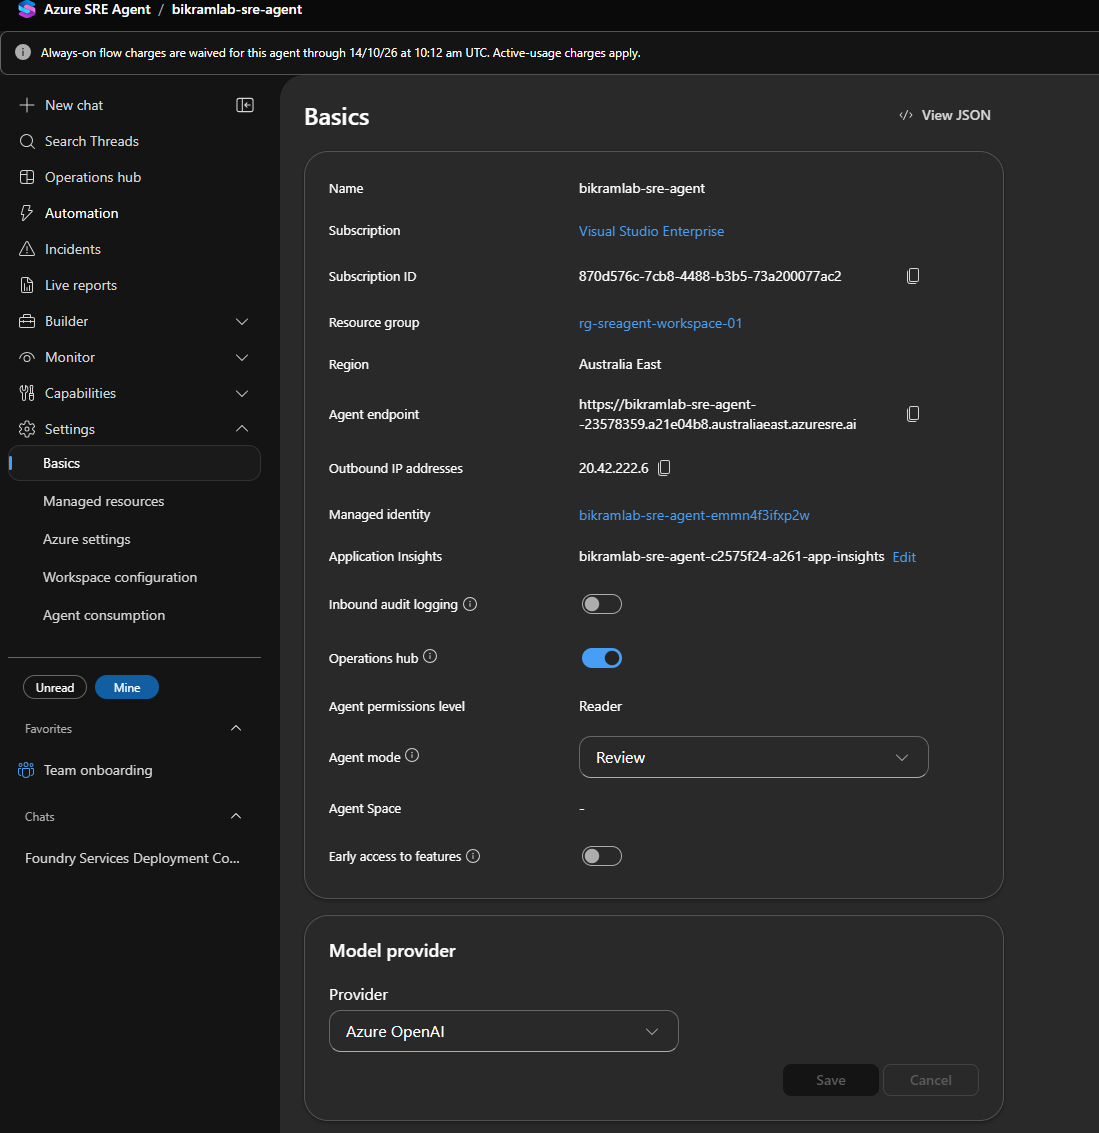
Under Settings then Basics:
| Field | Notes |
|---|---|
| Name, Subscription, Subscription ID, Resource group, Region | Set at creation. |
| Agent endpoint | The URL of the agent portal. |
| Outbound IP addresses | The addresses the agent calls out from, for firewall allow lists. |
| Managed identity | The user assigned identity created with the agent, and the one the connectors authenticate as. |
| Application Insights | The instance the agent writes traces to, changeable with Edit. |
| Inbound audit logging | Toggle, off by default. |
| Operations hub | Toggle, on by default. |
| Agent permissions level | Reader here. This is the ceiling for anything the agent does with its own identity. |
| Agent mode | Review here, which is what puts the approve and cancel buttons in front of each action. |
| Agent Space | Empty in this lab. |
| Early access to features | Toggle, off by default. |
| Model provider | Azure OpenAI or Anthropic, changeable after creation. |
Further down the same page:
- Onboarding in progress, with Continue to resume the setup chat or Reset to start it over. It appears while any context source is still unconfigured.
- Stop agent, which halts all agent activity. Always-on agent unit consumption continues while it is stopped.
- Delete SRE Agent, which removes the agent and all of its chat and action threads.
Workspace configuration
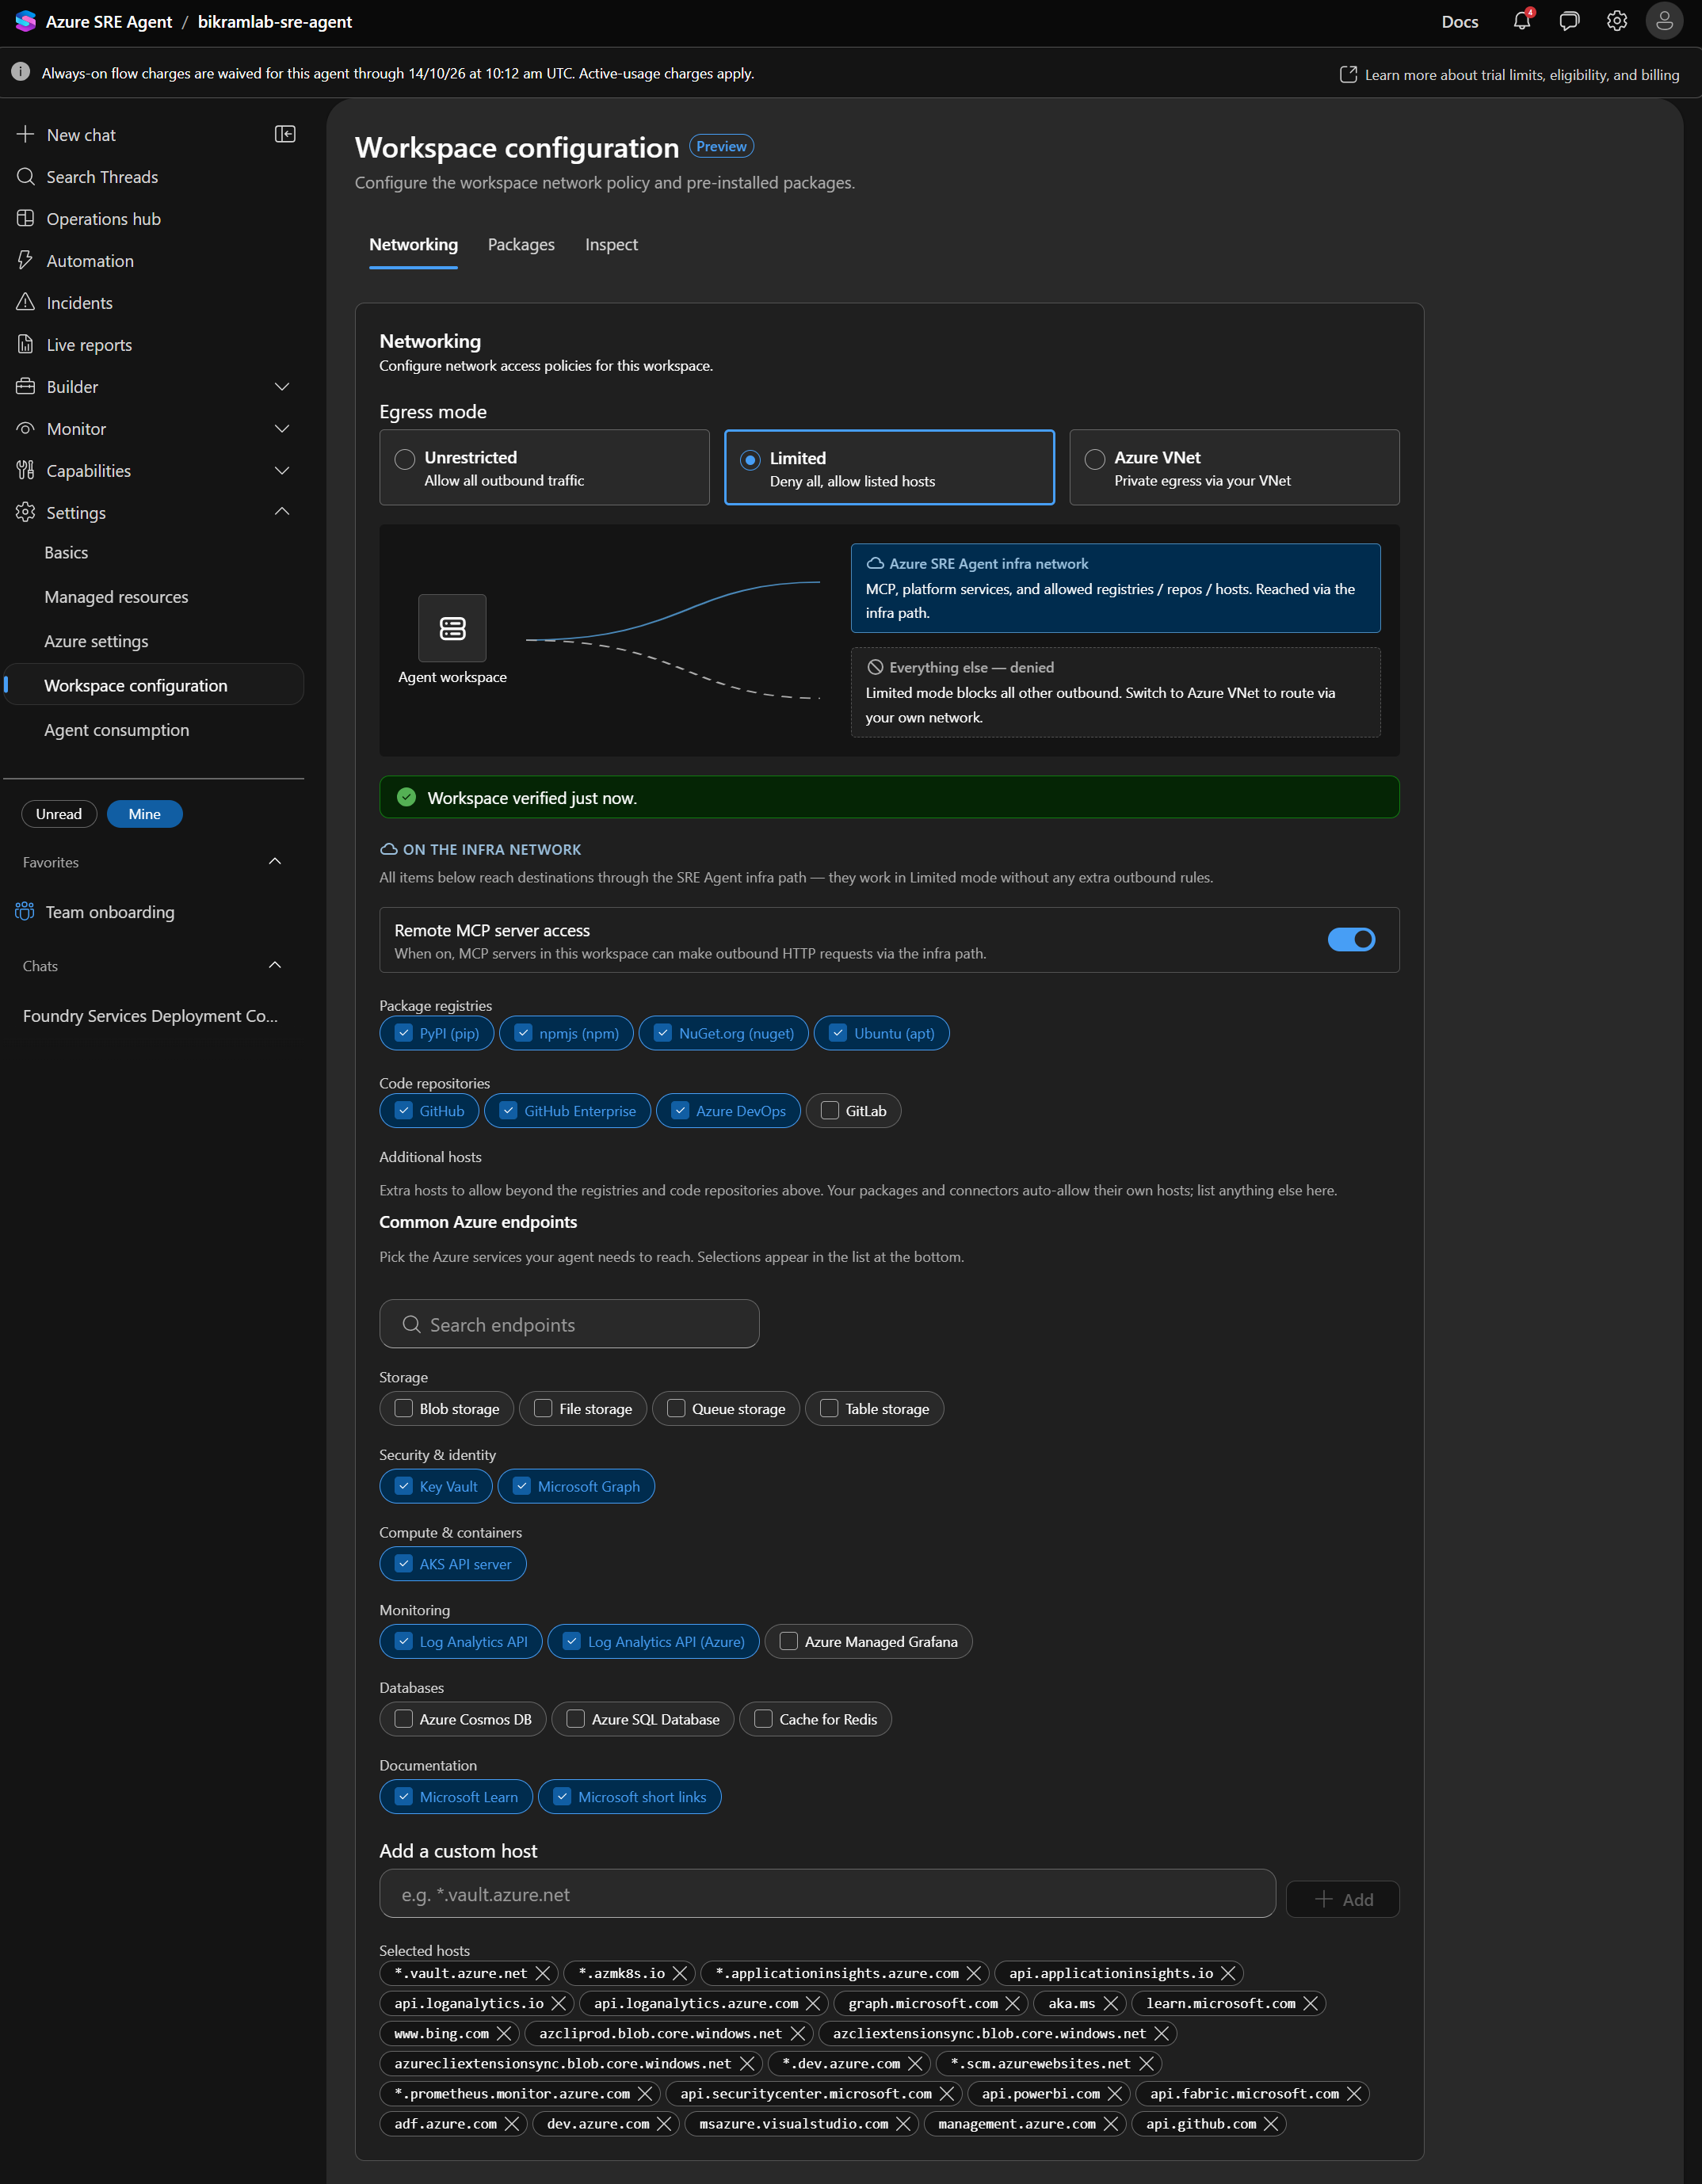
Marked Preview. Three tabs: Networking, Packages, Inspect. This is where the agent's sandbox workspace is governed, and where the egress mode lives.
Networking
Egress mode is one of three, and switching it does not discard the settings belonging to the other modes:
| Mode | Card text |
|---|---|
| Unrestricted | Allow all outbound traffic |
| Limited | Deny all, allow listed hosts |
| Azure VNet | Private egress via your VNet |
In Limited mode the page splits outbound traffic into two paths. Anything on the SRE Agent infra network reaches its destination without extra outbound rules: MCP, platform services, and the registries, repositories and hosts you tick. Everything else is denied, and the card says so plainly, pointing at Azure VNet as the way to route it through your own network.
The infra network section holds:
- Remote MCP server access, a single toggle that lets MCP servers in the workspace make outbound HTTP requests over the infra path.
- Package registries: PyPI (pip), npmjs (npm), NuGet.org (nuget), Ubuntu (apt).
- Code repositories: GitHub, GitHub Enterprise, Azure DevOps, GitLab, each ticked independently.
- Additional hosts, with a searchable list of common Azure endpoints grouped as Storage, Security and identity, Compute and containers, Monitoring, Databases, and Documentation, plus a free text Add a custom host field. Selected hosts appear as removable chips, for example
*.vault.azure.net,api.loganalytics.io,*.prometheus.monitor.azure.comandmanagement.azure.com.
A status line above the section says when the workspace was last verified.
Selecting Azure VNet puts your VNet in a pending state until a subnet is bound, and the page keeps the infra network path alongside it. Changes here are staged behind Save and Discard.
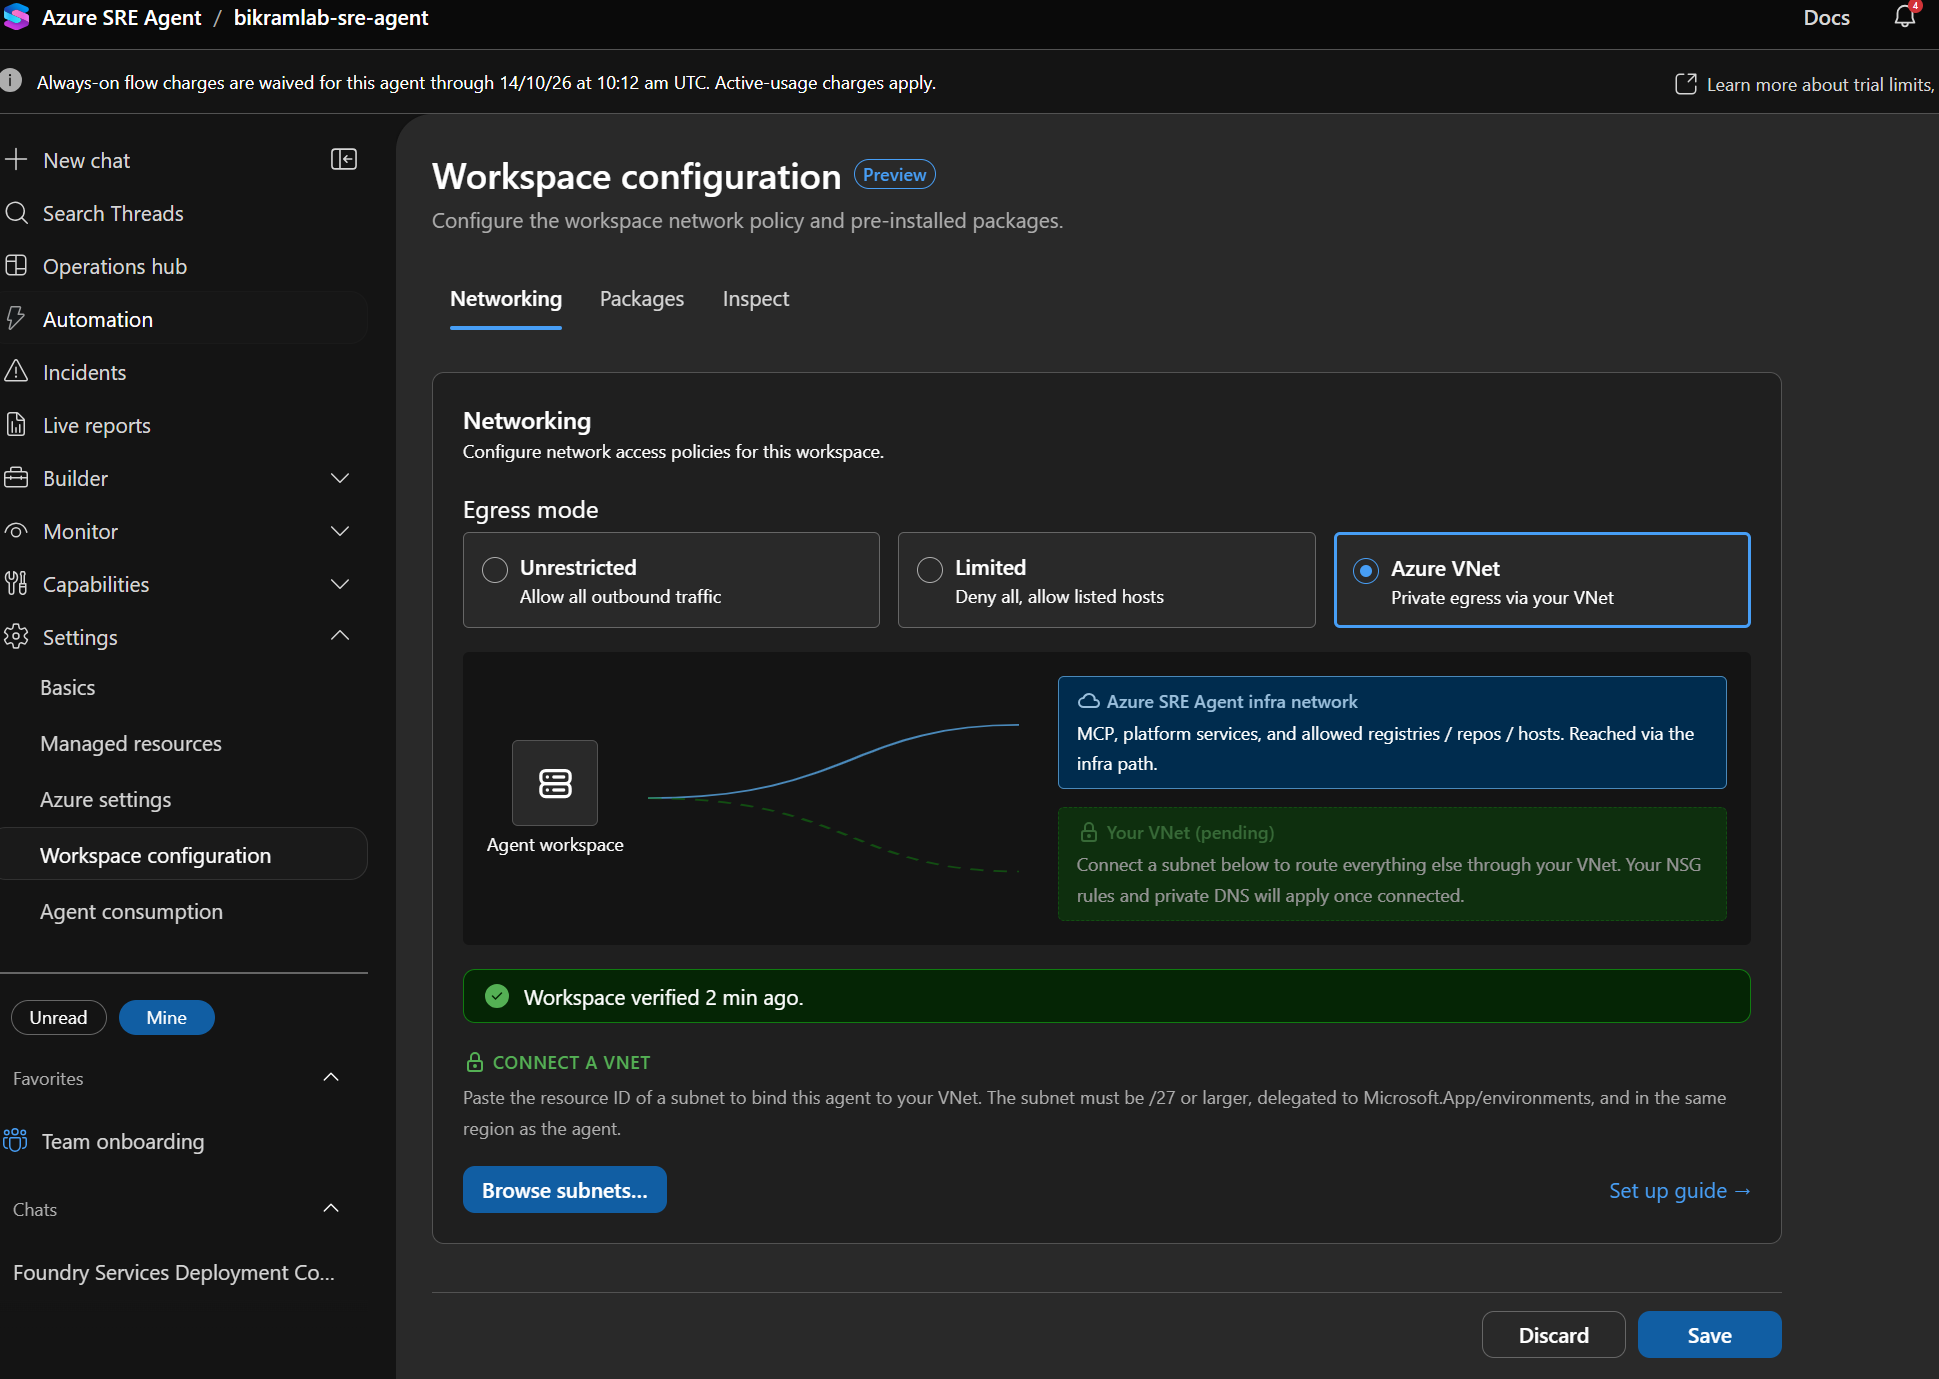
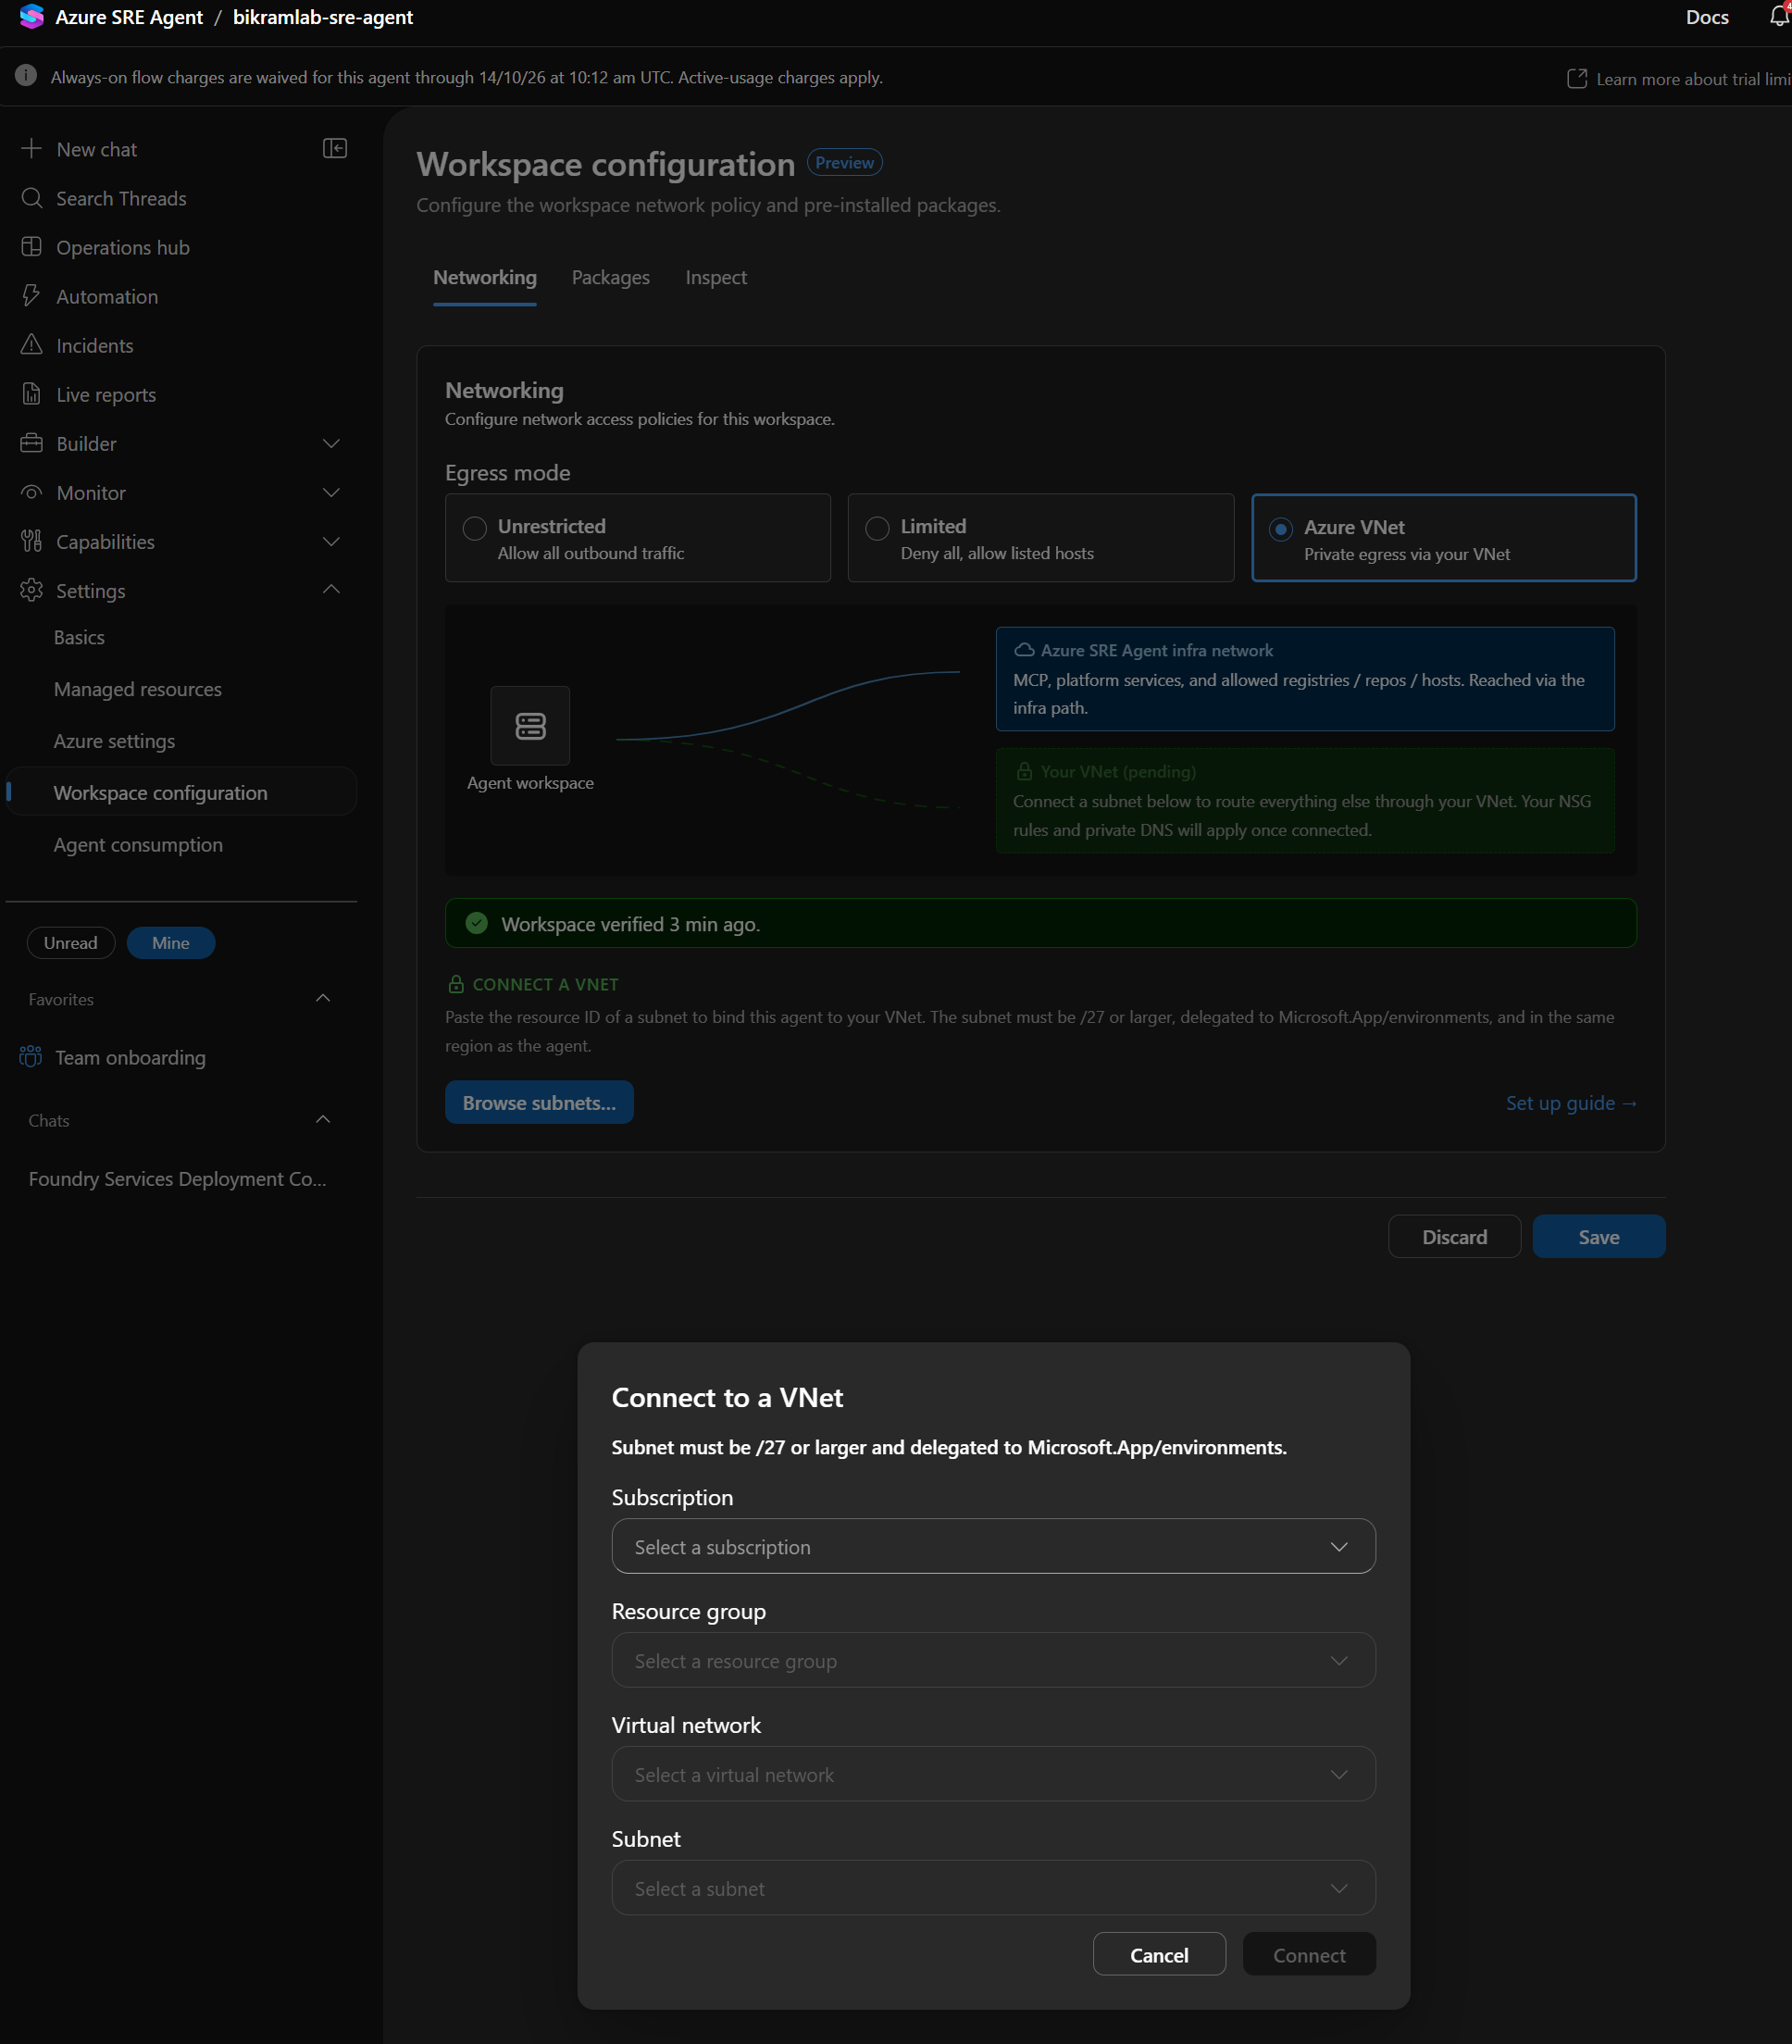
Browse subnets opens the connect dialog, which takes subscription, resource group, virtual network, and subnet. The stated requirement, repeated in both the page text and the dialog: the subnet must be /27 or larger, delegated to Microsoft.App/environments, and in the same region as the agent.
Packages
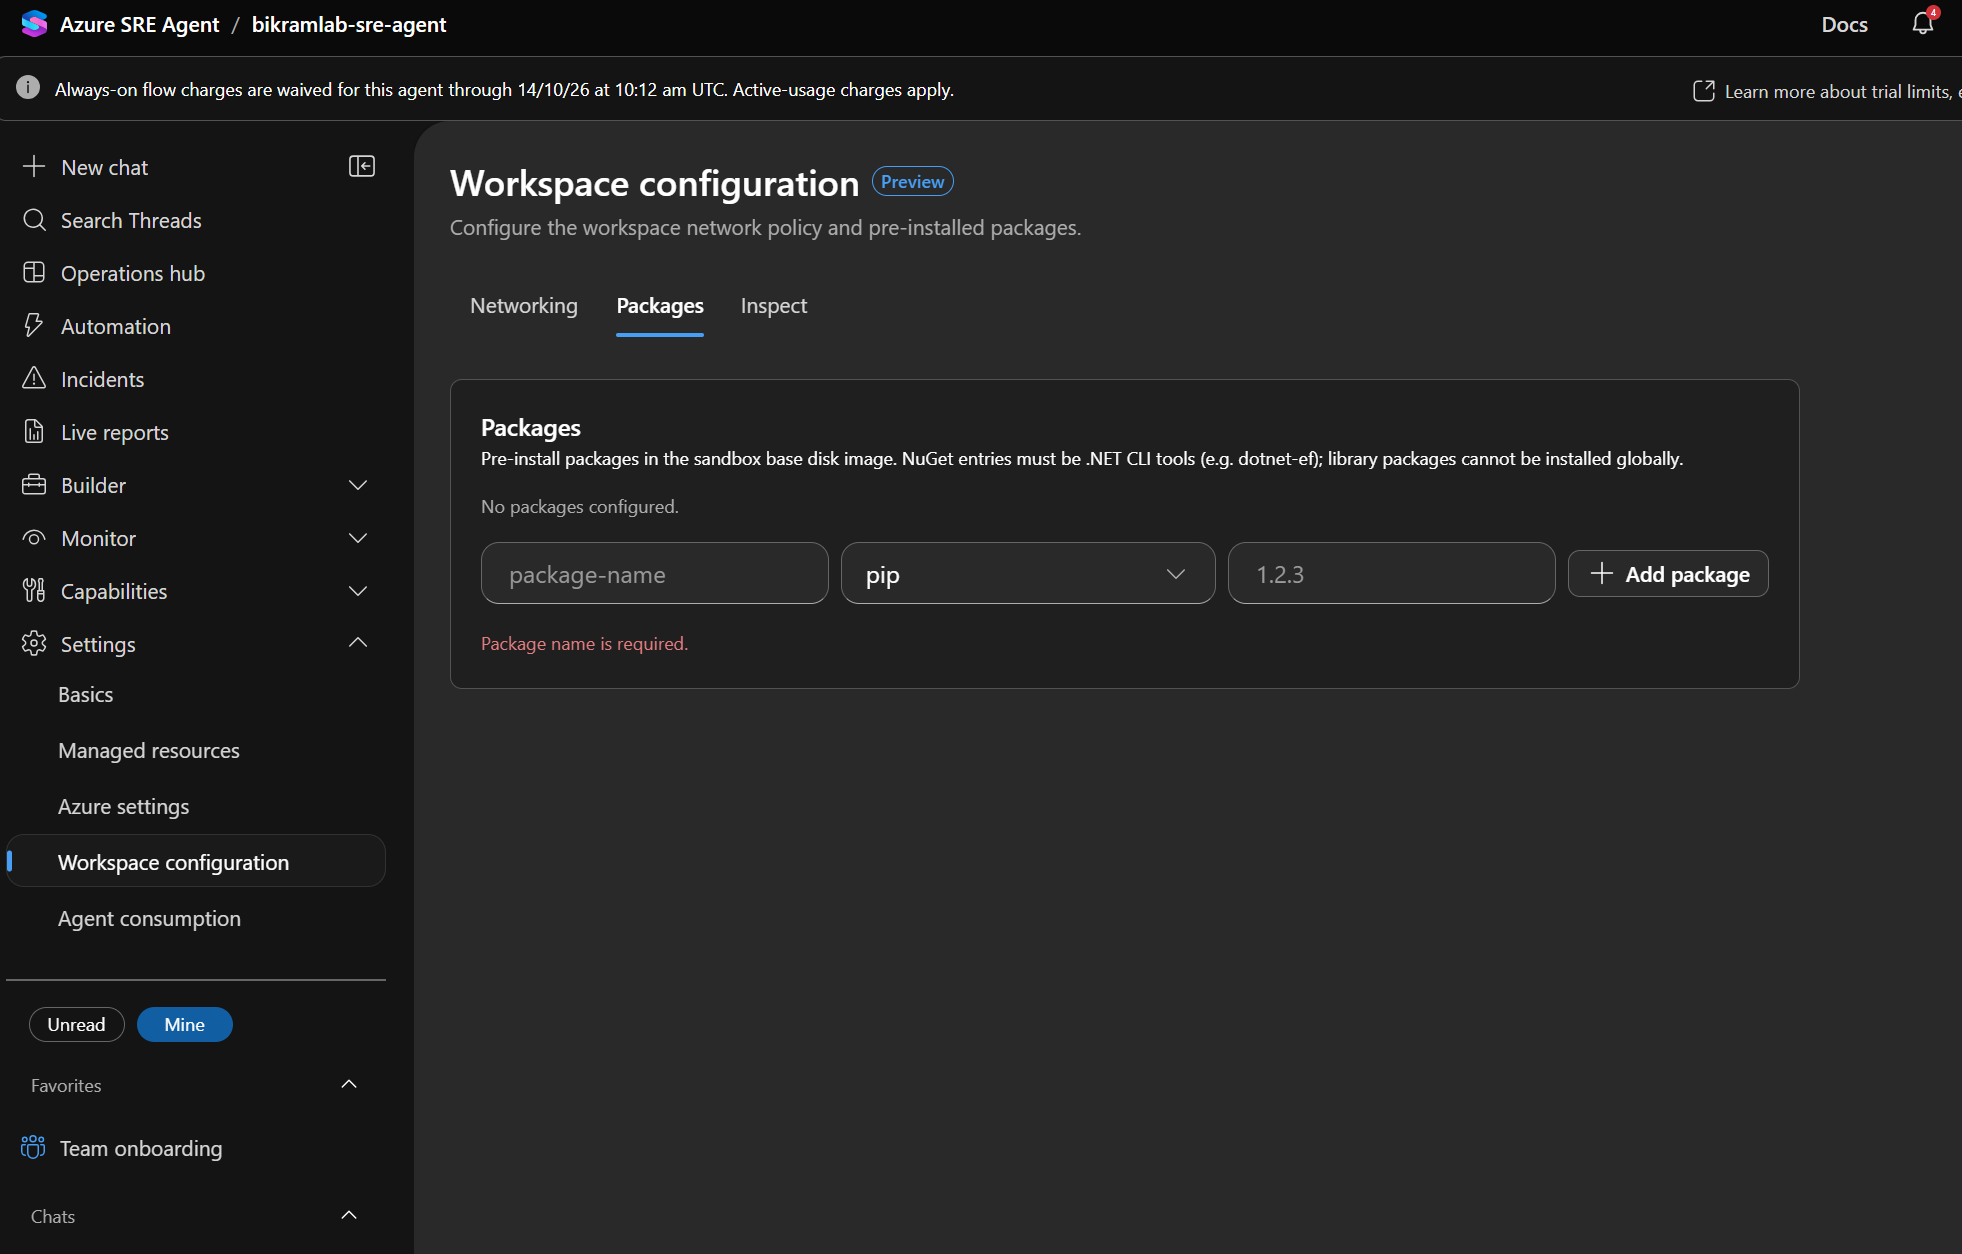
Packages are pre-installed into the sandbox base disk image, given as name, manager (pip and others in the dropdown), and version. NuGet entries must be .NET CLI tools such as dotnet-ef, because library packages cannot be installed globally. Nothing is configured by default.
Inspect
Administrator-only, and live. Three panes:
- A bash shell in the agent workspace, which opens at
root@adc-sandbox:/#. - Network audit, listing outbound requests with method, host, path, allowed or denied, and age, filtered by host or path and by All, Allowed, Denied, with running counts. The lab agent showed 11 allowed and 0 denied, mostly
GET management.azure.com/subscriptionsandHEAD raw.githubusercontent.com. - Files, a read-only browser clamped to the workspace root, which contains
codeRefs,config,memories,plugins,runtime-content, andtmp.
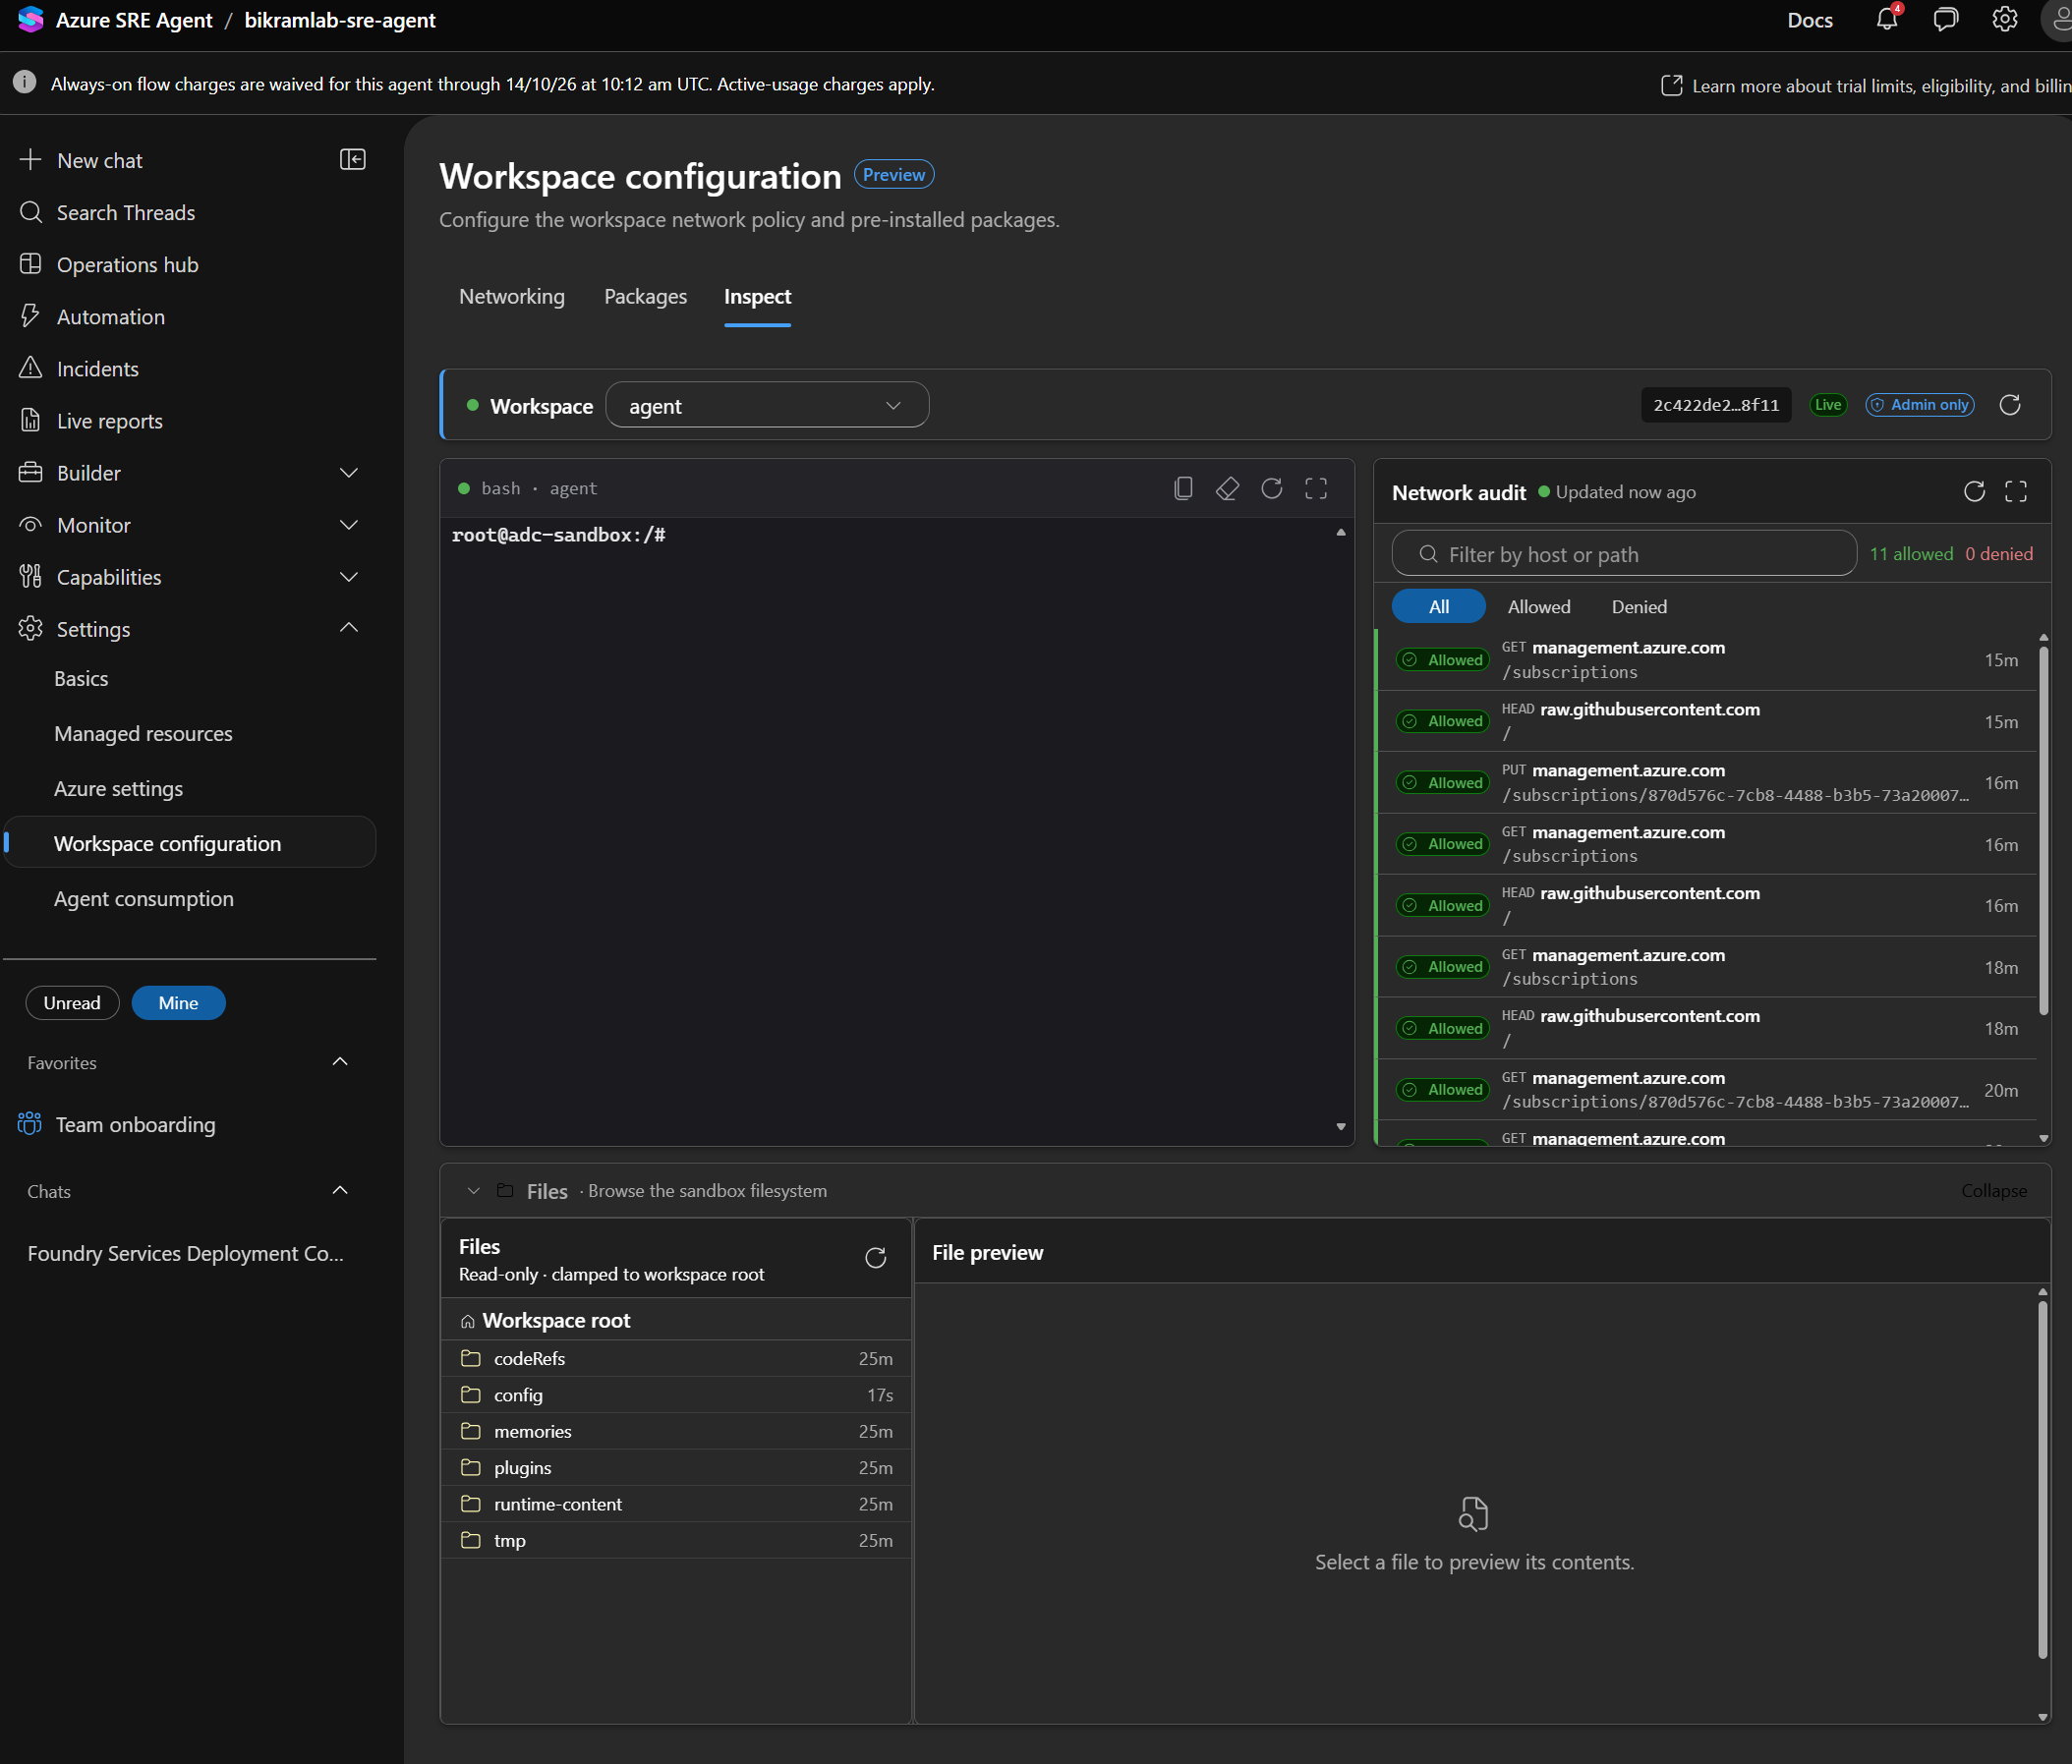
Network audit records the agent's own egress-policy decisions. It is not a network audit trail in the compliance sense, and About Azure SRE Agent in a governed estate covers what else you need to keep alongside it.
Agent consumption
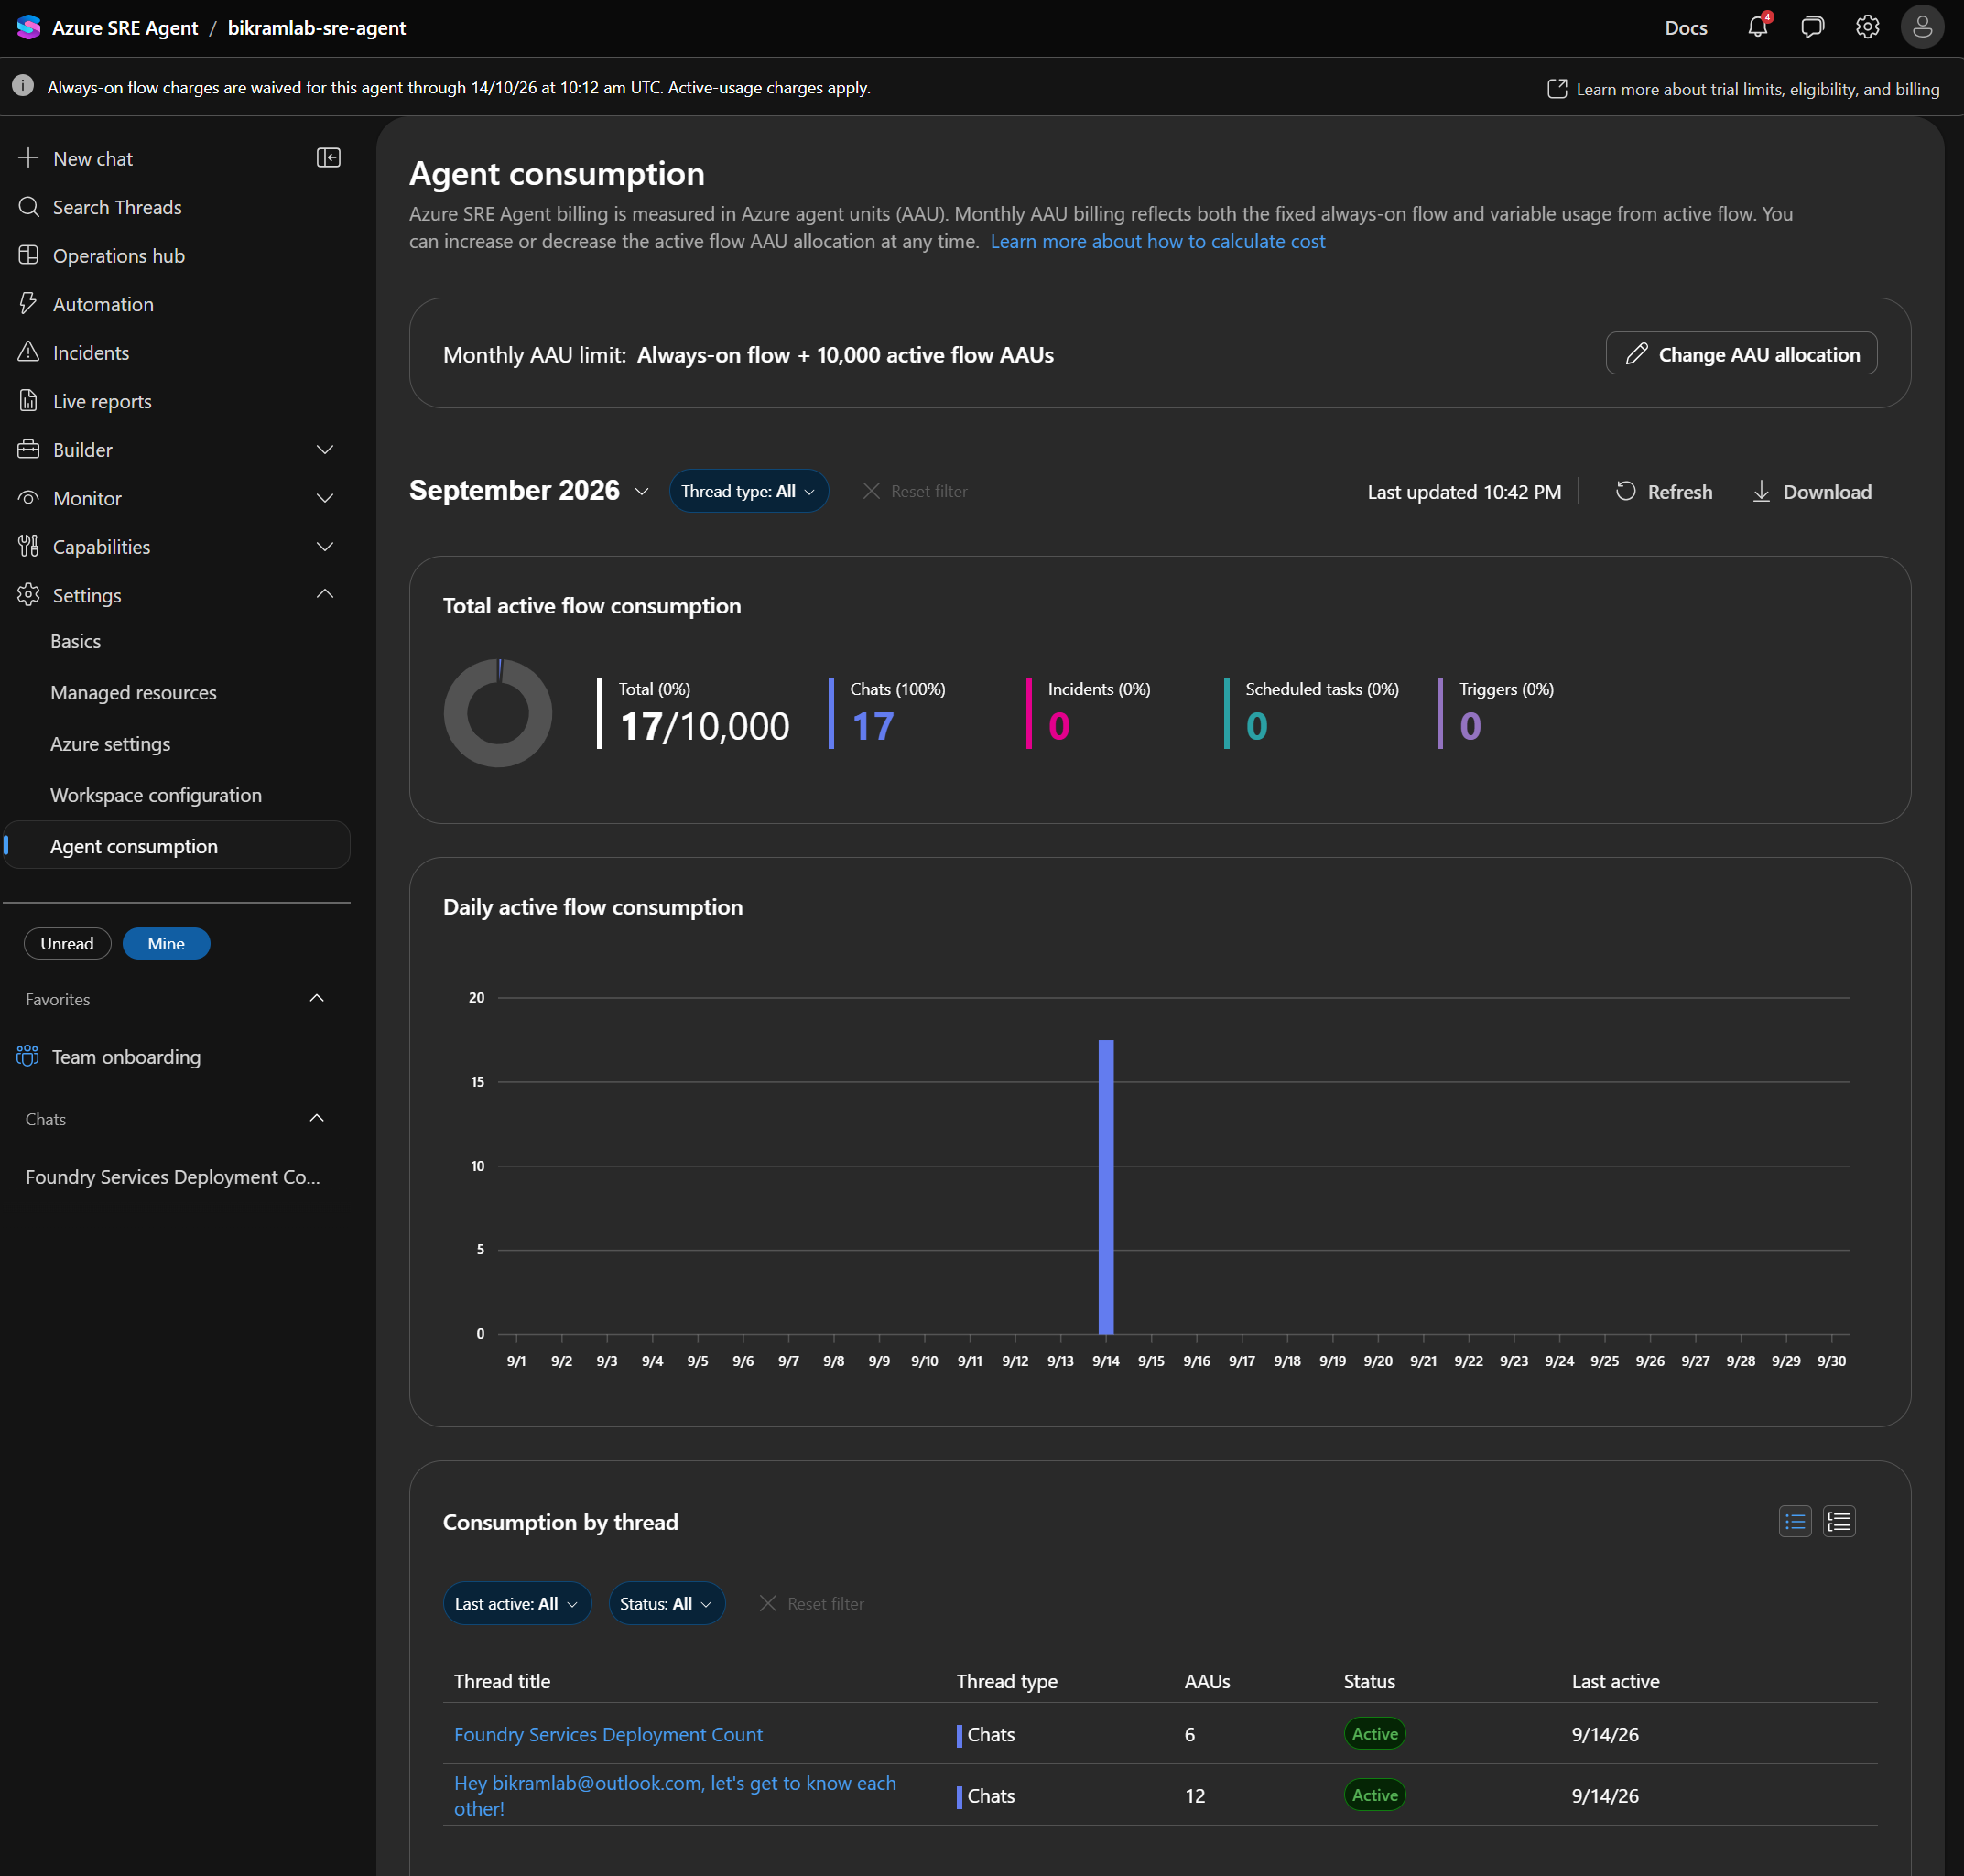
Billing is measured in Azure agent units (AAU), with a fixed always-on flow plus variable active flow. The page shows:
- The monthly AAU limit, phrased as always-on flow plus an active flow allocation. The lab agent was set to 10,000 active flow AAUs, changeable with Change AAU allocation.
- Total active flow consumption for the selected month, broken down by thread type: chats, incidents, scheduled tasks, triggers. The lab agent had used 17 of 10,000, all of it chats.
- Daily active flow consumption as a bar per day across the month.
- Consumption by thread, a table of thread title, thread type, AAUs, status, and last active, filtered by last active and status. Two threads here: the Foundry question at 6 AAU and the agent's own welcome thread at 12 AAU.
There is a Download action on the month view.
Telemetry
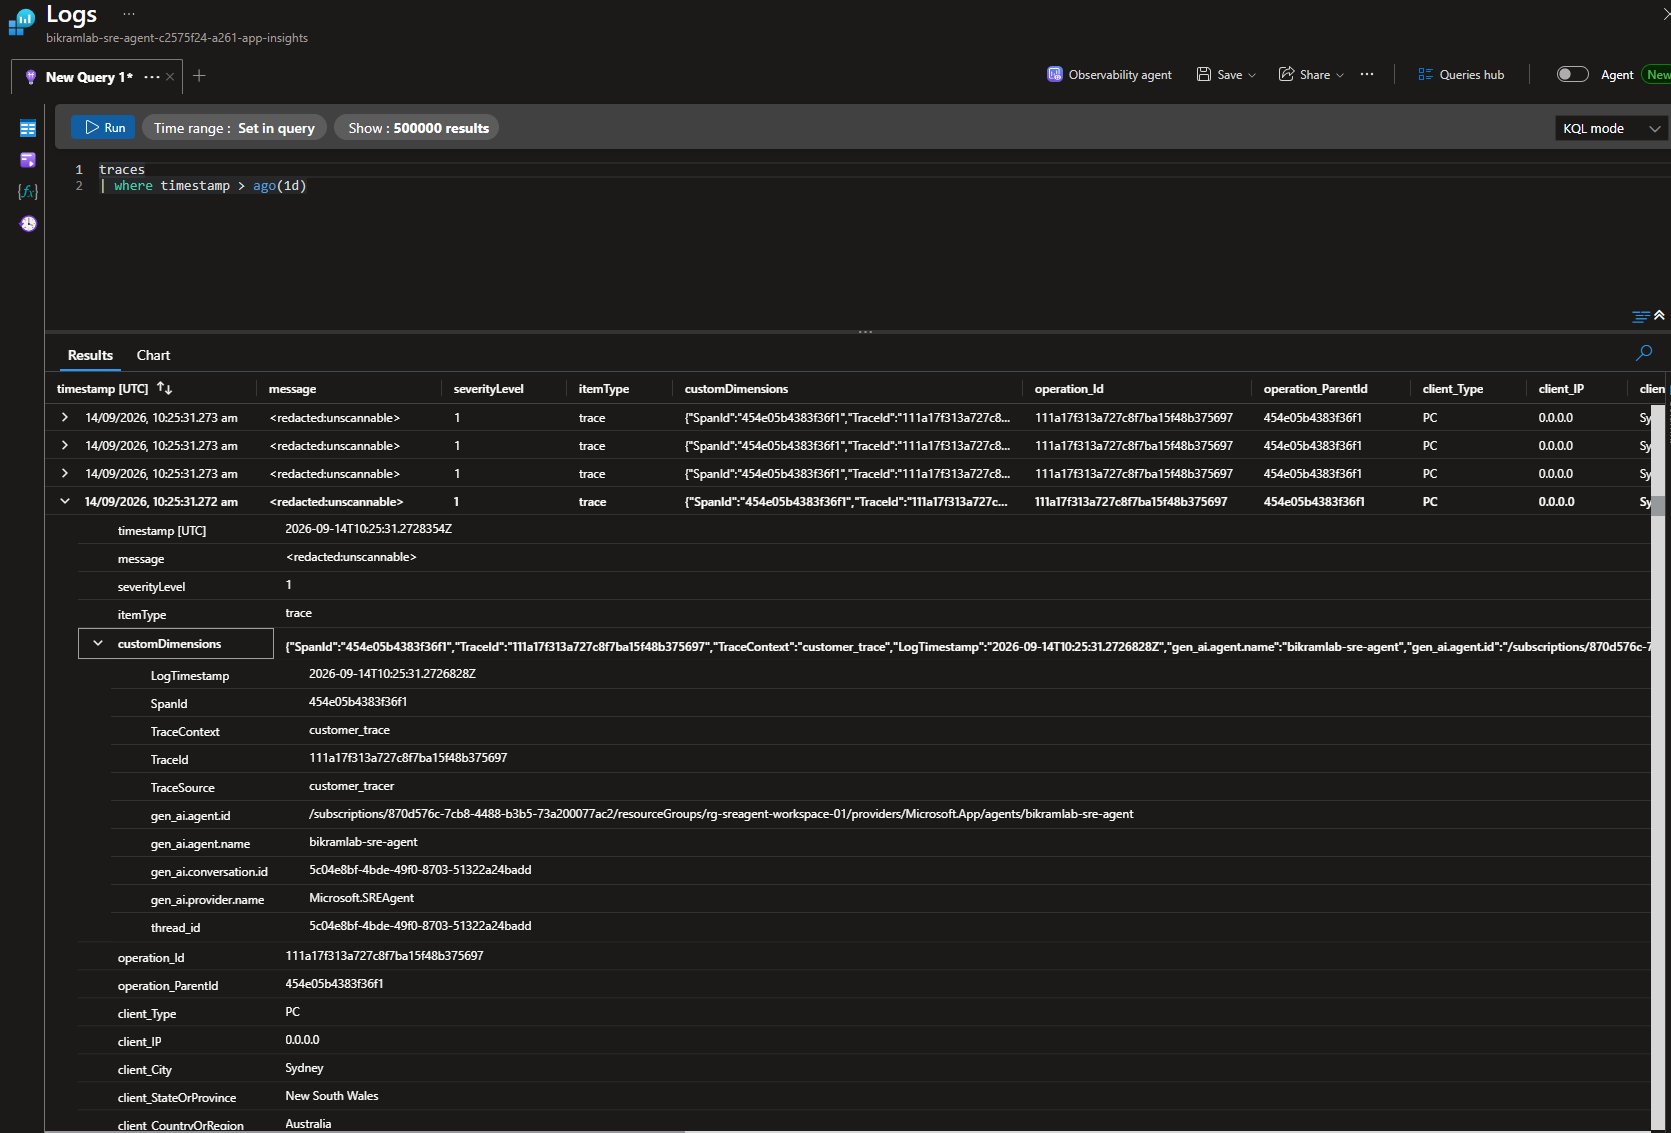
The agent writes to the Application Insights instance created with it. The traces land in the traces table and can be read with ordinary KQL:
traces
| where timestamp > ago(1d)
Each row carries customDimensions with the fields that make the traces joinable:
gen_ai.agent.id, the full resource ID of the agentgen_ai.agent.namegen_ai.conversation.idandthread_id, which match each other and identify the chatgen_ai.provider.name, which readsMicrosoft.SREAgentTraceId,SpanId,TraceContext(customer_trace),TraceSource(customer_tracer), andLogTimestamp
The message column can come back as <redacted:unscannable>, so the trace tells you an operation happened and which conversation it belonged to, not what was said.
The richer record is in customEvents rather than traces: tool calls with their input and output, model calls with token counts, incident snapshots and approval decisions. That event catalogue is in Azure SRE Agent governance reference.